1. INTRODUCTION
The red ceramics industry in Brazil is part of the non-metallic minerals processing segment. In 2015, the red ceramic industry was present in 90% of the masonry and roofs built in Brazil, representing 4.8% of the Civil Construction industry (ANICER, 2015). The sector consists of 9,071 small companies, responsible for generating an 18 billion annual income, producing about 1.3 billion tiles and 4 billion bricks per month, generating 300 thousand direct jobs and 1.5 million indirect ones (SEBRAE, 2015). By January 2018, the Sectorial Quality Program (PSQ) had qualified 101 companies in Ceramic Blocks (PSQ-BC) and 25 companies in Ceramic Tiles (PSQ-TC) in Brazil (ANICER, 2018). Despite the economic crisis that affected the construction field in the country, companies continue to invest in the quality of their products, strengthening the PSQ of the ceramic sector.
The growth rate of this industry will particularly depend on the evolution of the country's GDP and the families’ consumption of real estate produced by the construction industry, once this economic segment is downstream in the production chain of red ceramics formed by the families, construction material companies, construction companies and public authorities (MME, 2010). Data from SEBRAE (2015) show that the distribution of red ceramic activity in each region in 2015 was as follows: 4.34% in the North, 21.25% in the Northeast, 8.69% in the Central West, 44.38% in the Southeast and 21.34% in the South. The State of Pará had the highest production in the North region and the 15th in the country, with 46 millions / company-month in 2012 (INT, 2012). In this region, there is a strong predominance of small companies, called potteries, with a family base, with low technological standards, low skilled labor and a low level of structure (ABDI, 2016).
The companies in the red ceramic industry in Pará have a high degree of homogeneity of physical resources - such as machinery and equipment, human resources - labor with low qualification and natural resources - clay as the main input of the productive process and limited financial resources (GOMES, et al., 2016).
A research developed by Negrão et al. (2015) identified the formation of a Local Productive Arrangement (APL) of red ceramic companies located in the region of Carajás, in the southeastern of Pará, a region with the second largest contribution to the Gross Domestic Product (GDP) of the state, with 16.7% and with a strong rate of economic growth (FAPESPA, 2017), which must increase the demand for infrastructure and stimulate the sales of the companies that produce bricks, tiles and other products.
According to data from the Ministry of Labor and Employment (MTE), in 2016, through the Annual Social Information Registry (RAIS), nine of the twelve municipalities located in Carajás registered activities producing ceramics, thus suggesting the potential for ceramist activity in the region (RAIS, 2016).
Considering the growth expectations of the economy in Carajás region, researches focused on the organizational environment of the red ceramic APL companies in Carajás are welcome and contribute to identify the management strategies and the positioning of companies in face of their efficiency and effectiveness, as the study done by Gomes et al. (2016), using Exploratory Factor Analysis (AFE), produced the Competitive Performance Index (IDC) of the companies of this APL and identified latent variables related to production, market and employment, public policies and finances, structure, governance and advantages associated to the local environment, innovation, cooperation and learning that work on the competitive performance of the companies.
The efficiency in the production process is a part of the management control and can be used not only as a reference when a decision is made but also as a basis for improving processes. Therefore, evaluating efficiency is fundamentally important because it assists decision-making and provides inputs that facilitate the monitoring, comparison, and correction of organizational performance (DOHNPOS, COHEN, 2014).
In this sense, efficiency measurement is an important and comprehensive issue for companies, because only those that evaluate themselves are able to take improvement measures that allow them to overcome the challenges that current contexts require (OLIVEIRA et al., 2015). In this context, the article intends to answer the following research question: what is the level of efficiency and effectiveness of the companies of the APL of red ceramics in the Carajás region in the state of Pará?
In order to respond to the research problem, the objective of this study is to calculate and analyze the level of technical efficiency in the APL companies and to identify benchmark companies. In order to achieve these objectives, the non-parametric Data Envelopment Analysis (DEA) technique was applied, widely used in studies that aimed to analyze how well a company transforms inputs into outputs (products and / or services) in relation to their highest potential (PART-ESTEBAN; ALBERCA-OLIVER, 2015).
In addition, the results of this study bring two contributions: an academic one, for expanding the scope of application of the DEA using specific inputs and products of the Red Ceramics Industry present in the embryonic APL located in the region of Carajás (PA); and another contribution to the set of companies in APL, which are part of this analysis, for appropriating the results of the research to define strategies that make them more efficient.
The article is structured in five sections, starting by this introduction. The second section deals with the theoretical review. The following section explains the materials and methods used to develop the research. The fourth section describes the results and the discussions obtained in the work and, finally, the conclusion of the same.
2. MATERIALS AND METHODS
This research is based on a quantitative and exploratory study carried out with a sample of companies from the red ceramics industry from the region of Carajás / PA in order to determine and evaluate the efficiency and effectiveness of the companies. The stages of research development are divided into:
First stage (Literature review): following the postulates of Calvaignac; Petiot (2017), a descriptive and analytical evaluation of the literature was done, supported by qualitative and quantitative analyzes. In this literature reviewing process, there were selected the works developed by Giacomello; Oliveira (2013), Vasconcelos et al. (2016), Garcia et al. (2017) and Rabelo et al. (CCR) and technical efficiency (BCC), although they are applied in different economic segments of the red ceramic industry such as hotels, academic units of a university and port terminals.
Second stage (Data collection): The data collection was conducted considering a set of 21 active companies out of a total of 28 identified in the region according to the basis of the Annual Social Information Register (RAIS), made in 2015. 7 remaining companies were closed or non-existent or refused to participate in the research. From the total number of companies surveyed, 10 were located in the municipality of Eldorado dos Carajás and 11 in the municipality of Marabá.
Third stage (Selection of variables): The definition of the variables used in the research was based on the authors' knowledge obtained in the literature review stage, during the field collection and at the moment of the qualitative analyzes elaborated from in-depth interviews conducted with managers and business owners. The input variables were the number of suppliers, the number of employees and the price of the main raw material (clay); the selected output variables were Per capita Productivity, Profit Margin on total costs and Percentage of Net Operating Revenue by the Income.
Fourth stage (Analysis and interpretation of the results): Based on the collected data, we started the interpretation and analysis of the data after application of the DEA using SIAD v3 (Integrated Decision Support System) software, on which it was possible to calculate all the results of the classical DEA models (efficiency, weights, targets, benchmarks and clearances) and the inverted frontier – multi-criteria decision support method. The red ceramics industry of Carajás / PA can be classified as homogeneous since the companies produce the same products, with comparable inputs and outputs, present the same sets of inputs available and the production environment is similar between the companies, which makes possible the application of the DEA. According to Bertoloto (2011), this is an assumption for the use of the DEA. The input-oriented CCR and BCC models were chosen for the characteristics of the region's red ceramics industry, which allows DMUs to consume considerable amounts of resources and obtain decreasing returns of scale or vice versa (BERTOLOTO; MELLO, 2011; CHARNES ET AL., 1978; GUEDES ET AL., 2008; SANTOS; SPROESSER, 2013).
3. LITERATURE REVIEW
3.1. Concept of efficiency
In an objective way, efficiency can be understood as the way to carry out a task, or, how the inputs are used in the productive process to obtain a final product. It is understood by efficiency what Gomes et al. (2015) referred to, as the "way of carrying out a task by an organization, assuming that the optimal combination of inputs, by an appropriate methodology, will result in the maximum of products." Effectively, the concept of productivity is the efficient use of productive resources in order to achieve maximum production in the shortest time and with the lowest cost (SANDRONI, 2002). According to Ferrel (1957), the efficiency can be the Technique, which expresses the firm's ability to obtain the maximum of product with a combination of inputs. It can also be Allocation that is the use of inputs in optimal dimensions considering their relative prices. In this sense, efficiency is the relationship between what is produced and what should be produced and it is used to control productive activities in order to increase production without the need for investments.
According to Byrns and Stone (1996), economic efficiency is achieved "when we produce a combination of products with the highest possible total value considering our limited resources." This production is defined as Allocation when we define what things will be produced; Productive when we define how they are produced; and Distributive when we identify who will use the products.
The economic efficiency is obtained from the relation between the commercial value of a product and its unit cost, in such a way that, with the same cost of inputs, a productive unit can obtain a higher level of production and be the most efficient one. Therefore, Peña (2008) states that "an organization may be technically efficient but inefficient in economic terms", which occurs when the combination of inputs does not lead to the lowest cost.
Efficiency can also relatively defined by comparing output per each unit of input with what could be consumed with the same amount of input, as presented by Ferreira and Gomes (2012). For the authors, in this comparison process, a productive unit will have a complete efficiency, if and only if the performance of the other units does not demonstrate that some inputs or products can be improved without worsening the use conditions of the other inputs and products of the other productive units.
Efficiency measures should be defined on the basis of an efficient production or by the best practices known in the market, comparing the results with real data, uniformly collected, in areas that perform the processes in a standardized way, in order to have a more realistic analysis (FARREL, 1957, FØRSUND AND HJAL- MARSSON, 1979).
The companies in an economic segment pursue the productive efficiency of their processes as a way to achieve the highest performance and have a prominent position in the competitiveness arena by adopting strategies to use their available physical and human resources. Identifying inefficient productive units, relating them to the efficient ones, is strategic information for managers in their decision-making on optimal levels of inputs and outputs.
3.2. Data Envelopment Analysis (DEA)
The Data Envelopment Analysis (DEA) is considered as a mathematical tool used to measure the efficiency of productive units, DMUs (MELLO et al., 2003). In this research, the DMU refers to a company of the red ceramic industry located from the region of Carajás (PA) to be evaluated by the DEA.
According to Freitas et al. (2017), this technique allows the relative performance of units designated by DMUs (Decision Marking Units) to be analyzed. DMU’s are units that use the same types of inputs to produce the same assets and / or services. Considering inputs and outputs that can be continuous, ordinal or categorical variables and can be measured in different units (ANDRÉ et al., 2018). According to Cooper, Seiford and Tone (2000), with the DEA results, an inefficient DMU can be projected onto the production efficiency curve, and with this information, inefficient DMU managers can re-elaborate their productive strategies from the optimum levels of inputs and outputs, in order to become more efficient.
In the chart, the points C, D, E, F and G are the efficient units because they are located on the border, while the points A and B are considered inefficient because they are below it, as it is shown in Figure 1.
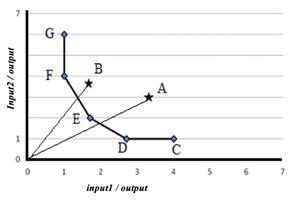
Figure 1: Efficient DMUs and non-efficient ones from a problem concerning DEA.
Source: Ferreira e Gomes (2012).
For Ferreira and Gomes (2012), the DEA is a promising model for evaluating the competitive environment of organizations that aim to evaluate the efficiency of their processes. However, evaluating the performance of a company may not be such an easy task to do, when using multiple inputs and producing multiple outputs.
3.3. Mathematical Models
According to Lins; Almeida; Bartholo Junior (2004), the DEA method has two classical models: the CCR model, in which there is a directly proportional relationship between the input and output variables, i.e., an increase or decrease in the input variables results in a proportional increase or decrease in the output variable; the BCC model, in which the evaluated variables present variable returns of scale, in this case the addition of the input variables can generate a non-proportional increase in the output variable, therefore allowing to identify a difference between the technical efficiency and the efficiency of scale (NEVES JÚNIOR et al, 2010).
According to Angulo-Meza et al. (2003), the formulation of the linearized CRS or CCR model can be represented by Equation 1.
Max:

which is subject to (1)


![]()
In this model, the acronyms represent:
n: quantity of used DMUs;
m: input quantity;
s: output quantity;
![]() : the efficiency of the DMU o in analysis;
: the efficiency of the DMU o in analysis;
![]() : The input i of the DMU k;
: The input i of the DMU k;
![]() : the output j of the DMU k;
: the output j of the DMU k;
![]() : the weight attributed to the input i;
: the weight attributed to the input i;
![]() : the weight attributed to the output j;
: the weight attributed to the output j;
The results obtained in the CCR model characterize the productive efficiency of resource consumption (when it is oriented to reduce resource consumption) and the productive efficiency of the result (when it is oriented to maximize the production of results) (CHARNES; COOPER; RHODES, 1978).
The difference between the CCR and BCC models is the scale factor that is present only in the BCC model, which is represented in equation 2.
Max:
which is subject to (2)
In this model, the acronyms represent:
s: output quantity;
![]() : the efficiency of the DMU o in analysis;
: the efficiency of the DMU o in analysis;
![]() : The input i of the DMU k;
: The input i of the DMU k;
![]() : the output j of the DMU k;
: the output j of the DMU k;
![]() : the weight attributed to the input i;
: the weight attributed to the input i;
![]() : the weight attributed to the output j;
: the weight attributed to the output j;
![]() : the scale factor.
: the scale factor.
Barbosa (2007) affirms that in the DEA metric, the 100% efficient DMUs (with Ej = 1) are considered as parameters for the model, i.e., they are present at the efficient border and all other DMUs are evaluated according to them, and they can be considered as benchmarking to be achieved by inefficient units that can imitate their productive processes to improve their efficiency.
3.4. Inverted Border
When you get results in which there are many productive units that reach the efficiency border, it becomes difficult for the administrator to choose the best production unit. In order to distinguish them it is necessary to introduce the concept of inverted border, which consists of considering products as inputs and inputs as products. This approach considers at least two interpretations. The first one is that the border consists of productive units with the worst management practices (and it could be called inefficient border); the second one is that these same productive units have the best practices considering the opposite point of view (MELLO et al., 2003).
The inverted production border technique aims to corroborate the representativeness of the studied companies (YAMANDA et al., 1994; ENTANI et al., 2002). After this procedure, it will be possible to obtain a combined rate between the original and inverted borders, which will provide a precise estimate of the efficiency of the units considered to be 100% in the mathematical calculations (MELLO et al., 2005; GUEDES et al., 2006).
In order to calculate the inefficiency border, an input exchange is made with the outputs of the original DEA model. Figure 2 shows the two borders, the classic one and the inverted one, for the DEA BCC case.
![]()
![]()
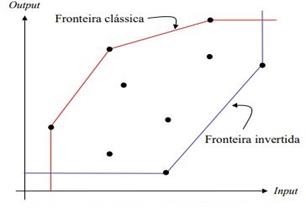
Figure 2: It shows an example of a classic border compared to an inverted one.
Source: Soares de Mello et al. (2005).
After analyzing the decision-making units and the set of variables, one can combine the standard and inverted borders and obtain the following types of efficiency: compound efficiency, obtained from the combination of classic and inverted efficiency, as equation 3.
![]() (3)
(3)
And the normalized compound efficiency obtained from the division of the compound efficiency value by the highest value among all compound efficiency values, as defined by Angulo Meza et al. (2005) and expressed in equation 4.
![]() (4)
(4)
4. RESULTS AND DISCUSSION
4.1. Exploratory analysis of data
From all the 21 companies surveyed, 16 are small companies and the others are classified as microbusinesses. From all the owners and managers interviewed, 50% of them are over 40 years old, in which 75% of them have completed or incomplete high school. The majority of business owners (62%) migrated from other activities, such as wood and livestock, to the red ceramics sector and the period after 2006 was the one that registered the largest number of new ceramics, which coincides with the increase of inspections and control of the companies in the wood-extracting sector and also the control of the beneficiation by the federal government.
The descriptive statistics for the variables used in the work are summarized in Table 1 and show that the level of heterogeneity of the companies, considering inputs and products, is high due to the high values of the variation coefficient. Besides the variable of Profit Margin on total costs (ProfitM), all the others present positive asymmetry, by showing the concentration of values on the left approaching the minimum value and high maximum values that reflect the heterogeneity in the set of the companies that were surveyed. Concerning the flatness measure of the distribution curve of variables known as kurtosis, the results show that, except for the ProfitM variable, all others present height above the normal curve.
Table 1 - Descriptive statistics and normality tests of input and output variables
|
Variable |
Minimum |
Maximum |
Average |
Standard deviation |
Variable coefficient |
Ass. |
Curt |
SW (p_value) |
|
Pcp value |
4.000,00 |
17.200,00 |
6.289,65 |
2.809,10 |
44,66 |
3,142 |
12,015 |
0,000 |
|
ProfitM |
2,50 |
18,00 |
9,95 |
4,73 |
47,60 |
-0,322 |
-0,873 |
0,085 |
|
RLO_Fat_Perc |
4,00 |
18,00 |
9,03 |
3,71 |
41,07 |
0,672 |
0,467 |
0,110 |
|
Employed people |
15,00 |
90,00 |
31,57 |
18,15 |
57,49 |
1,944 |
4,479 |
0,001 |
|
Number of suppliers |
1,00 |
10,00 |
3,23 |
2,427 |
74,95 |
1,340 |
1,959 |
0,002 |
|
Price (ton) – feedstock |
2,00 |
25,00 |
7,94 |
5,72 |
72,15 |
1,798 |
3,390 |
0,000 |
Source: Research results
KS - Kolmogorov-Smirnov
SW - Shapiro-Wilk
The result of the p_value after Spapiro-Wilk test application to evaluate the null hypothesis of normality of the study variables, which was presented in the last column of Table 1 shows, at a level of 5% statistical significance, that the variables ProfitM and RLO_Fat_Per are the only ones that they come from a normal distribution, since the p_value presents probability 8.5% and 11.0%, both above the acceptance limit, not rejecting the null hypothesis.
4.2. Analysis of efficiency using DEA
By analyzing Table 2, the results obtained by the SIAD v3 software show that the E6, E9, E10, E12, E14 and E15 DMUs are efficient in both the CCR and BCC models, while the Inefficient DMUs were E11 and E13. The results obtained using the inverted border show that the DMU E15 is inefficient, contrasting to the result obtained by the standard border, indicating a false efficiency. This evidence resulting from the application of the inverted model makes the decision making of the managers more sustained in qualified information.
Following the process of improving efficiency calculation models, Table 2 summarizes the efficiency values by the compound border model, in which the results obtained through the standardization of this measure enabled a better evaluation of the DMUs, in which the company E6 was the one that presented the greatest relative efficiency measure in both models, and the one that serves as a mirror for the other APL companies. While the E20 company registered the lowest efficiency level considering the models.
The average efficiency in the CCR and BCC models from the application of the normalized compound efficiency technique was 0.5646 and 0.6024, respectively. In which 11 of the 21 companies of the sample presented a below-average efficiency level using the CCR and BCC model, respectively. It should be noted that the BCC model presented a more homogeneous efficiency result than the one calculated by the CCR model, according to the coefficient of variation of 42.91% and 53.29%, respectively.
Table 2- Standard, inverted and compound Efficiency measures
|
STANDARD |
INVERTED EF |
COMPOUND EF |
NORMALIZED COMPOUND EF |
|||||
|
CCR |
BCC |
CCR |
BCC |
CCR |
BCC |
CCR |
BCC |
|
|
E1 |
0,8916 |
1,0000 |
0,9000 |
0,9167 |
0,4958 |
0,5417 |
0,5626 |
0,6326 |
|
E2 |
0,5765 |
0,9271 |
0,5321 |
0,6834 |
0,5222 |
0,6219 |
0,5925 |
0,7263 |
|
E3 |
0,9404 |
1,0000 |
0,4819 |
0,5398 |
0,7292 |
0,7301 |
0,8274 |
0,8527 |
|
E4 |
0,9328 |
1,0000 |
0,5127 |
1,0000 |
0,7100 |
0,5000 |
0,8057 |
0,5840 |
|
E5 |
0,4638 |
1,0000 |
1,0000 |
1,0000 |
0,2319 |
0,5000 |
0,2631 |
0,5840 |
|
E6 |
1,0000 |
1,0000 |
0,2374 |
0,2876 |
0,8813 |
0,8562 |
1,0000 |
1,0000 |
|
E7 |
0,5116 |
0,5713 |
1,0000 |
1,0000 |
0,2558 |
0,2857 |
0,2903 |
0,3336 |
|
E8 |
0,8328 |
0,9240 |
0,6110 |
0,6719 |
0,6109 |
0,6260 |
0,6932 |
0,7312 |
|
E9 |
1,0000 |
1,0000 |
0,3078 |
0,3258 |
0,8461 |
0,8371 |
0,9601 |
0,9777 |
|
E10 |
1,0000 |
1,0000 |
0,3590 |
0,3980 |
0,8205 |
0,8010 |
0,9310 |
0,9355 |
|
E11 |
0,3921 |
0,5016 |
1,0000 |
1,0000 |
0,1961 |
0,2508 |
0,2225 |
0,2929 |
|
E12 |
1,0000 |
1,0000 |
0,4180 |
0,6250 |
0,7910 |
0,6875 |
0,8975 |
0,8030 |
|
E13 |
0,2900 |
0,4310 |
1,0000 |
1,0000 |
0,1450 |
0,2155 |
0,1645 |
0,2517 |
|
E14 |
1,0000 |
1,0000 |
0,2505 |
0,3535 |
0,8748 |
0,8232 |
0,9926 |
0,9615 |
|
E15 |
1,0000 |
1,0000 |
0,7085 |
0,9146 |
0,6458 |
0,5427 |
0,7327 |
0,6339 |
|
E16 |
0,6138 |
0,6740 |
1,0000 |
1,0000 |
0,3069 |
0,3370 |
0,3482 |
0,3936 |
|
E17 |
0,4808 |
0,5000 |
1,0000 |
1,0000 |
0,2404 |
0,2500 |
0,2728 |
0,2920 |
|
E18 |
0,4155 |
0,6235 |
1,0000 |
1,0000 |
0,2077 |
0,3118 |
0,2357 |
0,3641 |
|
E19 |
0,5021 |
0,8205 |
0,7641 |
0,8549 |
0,3690 |
0,4828 |
0,4187 |
0,5639 |
|
E20 |
0,3144 |
0,3320 |
1,0000 |
1,0000 |
0,1572 |
0,1660 |
0,1783 |
0,1939 |
|
E21 |
0,4740 |
0,5794 |
0,6498 |
0,6506 |
0,4121 |
0,4644 |
0,4676 |
0,5424 |
|
Average |
0,6968 |
0,8040 |
0,7016 |
0,7725 |
0,4976 |
0,5158 |
0,5646 |
0,6024 |
|
Standard Deviation |
0,2693 |
0,2360 |
0,2873 |
0,2620 |
0,2651 |
0,2213 |
0,3009 |
0,2585 |
Source: Research results
The E11,
E20 and E13 companies were the ones that presented the lowest efficiency values
in both models, changing only the ranking among them. Analyzing the two models,
there were small changes in the ranking among the DMUs, a great change of
placement stands out in the E4 DMU, which is in the 7th place in the CCR model,
falling to 11th in the BCC model, according to Table 3.
Table 3 - Ranking of normalized compound efficiencies of the companies - CCR and BCC models
|
CCR |
BCC |
||||
|
POSITION |
DMU |
COMP. NORM. EF |
POSITION |
DMU |
COMP. NORM. EF |
|
1º |
E6 |
100,00 |
1º |
E6 |
100,00 |
|
2º |
E14 |
99,26 |
2º |
E9 |
97,77 |
|
3º |
E9 |
96,01 |
3º |
E14 |
96,15 |
|
4º |
E10 |
93,10 |
4º |
E10 |
93,55 |
|
5º |
E12 |
89,75 |
5º |
E3 |
85,27 |
|
6º |
E3 |
82,74 |
6º |
E12 |
80,30 |
|
7º |
E4 |
80,57 |
7º |
E8 |
73,12 |
|
8º |
E15 |
73,27 |
8º |
E2 |
72,63 |
|
9º |
E8 |
69,32 |
9º |
E15 |
63,39 |
|
10º |
E2 |
59,25 |
10º |
E1 |
63,26 |
|
11º |
E1 |
56,26 |
11º |
E4 |
58,40 |
|
12º |
E21 |
46,76 |
12º |
E5 |
58,40 |
|
13º |
E19 |
41,87 |
13º |
E19 |
56,39 |
|
14º |
E16 |
34,82 |
14º |
E21 |
54,24 |
|
15º |
E7 |
29,03 |
15º |
E16 |
39,36 |
|
16º |
E17 |
27,28 |
16º |
E18 |
36,41 |
|
17º |
E5 |
26,31 |
17º |
E7 |
33,36 |
|
18º |
E18 |
23,57 |
18º |
E11 |
29,29 |
|
19º |
E11 |
22,25 |
19º |
E17 |
29,20 |
|
20º |
E20 |
17,83 |
20º |
E13 |
25,17 |
|
21º |
E13 |
16,45 |
21º |
E20 |
19,39 |
|
Average |
|
0,5646 |
|
|
0,6024 |
|
Standard Deviation |
0,3009 |
|
|
0,2585 |
|
Source: Research results
Due to the numerical proximity of the results of the average and the standard deviation for the CCR and BCC models, a t-test of averages for two-tailed paired samples was carried out in order to evaluate if there are statistical differences between the average for each of the models. The result showed that there is not any evidence to reject the hypothesis that the averages are equal to a significance level of 5.0% since the p-value was 0.120.
In the Data Envelopment Analysis, the influences (benchmarks) executed by any units over the others are also measured. Table 4 shows the reference DMUs for the companies with low efficiency in the two models. The closer the value is to 1, the stronger the influence is. The identification of the main benchmarks is of extreme importance to inefficient DMUs as strategic information, once the operational practices and strategic projects can be shared among them.
Table 4 - Main benchmarks for DMUs with low efficiency
|
DMUs WITH LOW EFFICIENCY (COMPANIES) |
DMUS REFERENCES |
|||||||
|
CCR |
BCC |
|||||||
|
E7 |
E6 0,7279 |
E12 0,0885 |
E15 0,1836 |
|||||
|
E11 |
E9 0,4889 |
E12 0,2889 |
E9 0,5486 |
E12 0,4514 |
||||
|
E13 |
E10 0,0829 |
E14 0,5386 |
E1 0,2202 |
E4 0,4911 |
E6 0,0145 |
E10 0,2743 |
||
|
E17 |
E10 1,000 |
|||||||
|
E18 |
E12 0,1636 |
E14 0,2881 |
E15 0,0833 |
|||||
|
E20 |
E9 0,9222 |
E12 0,0222 |
E9 0,9336 |
E12 0,0664 |
|
|||
Source: Research results
Continuing the analysis of Table 4, it is observed that the E7 Company should maintain contact only with the E6, E12 and E15 DMUs, to know their realities and share practices, in the BCC model. However, in the CCR model, the DMUs were not considered as references. The E11 Company must have as references the E9 and E12 DMUs, both in the CCR model as in the BCC model. In case of the E13 Company, it is necessary to base the E10 and E14 DMUs for the CCR model. However, in the BCC model, it has a larger number of DMUs as references: E1, E4, E6 and E10. The E17 Company only had the E10 DMU as a reference in the BCC model.
Concerning the E18 Company, its reference DMUs came only in the CCR model, which are the E12, E14 and E15. Finally, the E20 Company must "follow" the good practices of the E9 and E12 DMUs, both in the CCR model and in the BCC.
The weight provided by the model for each input variable identifies the most important variable in the efficiency rate. According to the average weight of the inputs for the CCR model, the main ones were the number of suppliers, followed by the price of the main feedstock and number of employees, in that order, 0.1014, 0.0226 and 0.0696, respectively. The BCC model follows the same sequence and order of the variables, however, the weight of the variable number of suppliers is 46.7% above recorded in the CCR model (0.1489) followed by 0.0254 and 0.0523, respectively.
The benchmark study recommends relations that can be strengthened in companies. However, it is also necessary to analyze the targets for the studied variables, in which the low efficiency DMUs recognize the points where they must work and become efficient. Table 5 shows the targets of the DMUs with previous low efficiency, and the last column presents the value of the gap in the model whose value zero indicates that the target was reached. In the case of the most efficient DMU, the gap is zero and the current value and the target are the same and equal to 1.0.
Table 5- Target of the units with low efficiency, directed to the input
|
DMU |
Model |
Variable |
Current (A) |
Target (B) |
Gap |
DMU |
Model |
Variable |
Current (A) |
Target (B) |
Gap |
|
E7 |
CCR |
X1 |
4,00 |
2,04 |
0,0 |
E17 |
CCR |
X1 |
4,0 |
1,9 |
0,0 |
|
X2 |
90,0 |
30,55 |
15,5 |
X2 |
61,0 |
23,1 |
6,2 |
||||
|
X3 |
8,0 |
4,09 |
0,0 |
X3 |
4,0 |
1,9 |
0,0 |
||||
|
BCC |
X1 |
4,0 |
2,3 |
0,0 |
BCC |
X1 |
4,0 |
2,0 |
0,0 |
||
|
X2 |
90,0 |
22,5 |
28,9 |
X2 |
61,0 |
24,0 |
6,2 |
||||
|
X3 |
8,0 |
4,6 |
0,0 |
X3 |
4,0 |
2,0 |
0,0 |
||||
|
E12 |
CCR |
X1 |
3,0 |
0,8 |
0,4 |
E18 |
CCR |
X1 |
4,0 |
1,1 |
0,5 |
|
X2 |
31,0 |
12,2 |
0,0 |
X2 |
27,0 |
11,2 |
0,0 |
||||
|
X3 |
20,0 |
7,5 |
0,3 |
X3 |
8,5 |
3,5 |
0,0 |
||||
|
BCC |
X1 |
3,0 |
1,0 |
0,5 |
BCC |
X1 |
4,0 |
2,5 |
0,0 |
||
|
X2 |
31,0 |
15,5 |
0,0 |
X2 |
27,0 |
16,8 |
0,0 |
||||
|
X3 |
20,0 |
10,0 |
0,0 |
X3 |
8,5 |
5,3 |
0,0 |
||||
|
E13 |
CCR |
X1 |
5,0 |
0,7 |
0,7 |
E20 |
CCR |
X1 |
4,0 |
0,9 |
0,3 |
|
X2 |
44,0 |
12,8 |
0,0 |
X2 |
48,0 |
15,1 |
0,0 |
||||
|
X3 |
8,0 |
2,3 |
0,0 |
X3 |
25,0 |
7,7 |
0,2 |
||||
|
BCC |
X1 |
5,0 |
2,2 |
0,0 |
BCC |
X1 |
4,0 |
1,0 |
0,3 |
||
|
X2 |
44,0 |
19,0 |
0,0 |
X2 |
48,0 |
15,9 |
0,0 |
||||
|
X3 |
8,0 |
3,4 |
0,0 |
X3 |
25,0 |
8,3 |
0,0 |
Source: Research results
Input variable: X1 = Number of suppliers; X2 = Number of employees; X3 = Price of the main feedstock,
The DMUs with the highest inefficiency level were listed in Table 5. The variables, number of suppliers (X1) and price of the feedstock (X3) presented a gap equal to zero in the CCR and BCC models for the E7 and E17 DMUs, i.e., the target number was reached for these variables. However, the variable number of employees presented a gap equal to zero for E12, E13, E18 and E20 DMUs. It is observed that, in general, the number of suppliers is the variable that demonstrated one of the highest rates of input values, which indicate that this input must be analyzed by these DMUs that obtained a low efficiency.
Table 6 summarizes the normalized compound efficiency in the municipalities of Marabá and Eldorado do Carajás according to the DEA calculation model. The results of the CCR and BCC models show that the municipality of Marabá presents an average that is higher than the one of Eldorado dos Carajás in both models, but the standard deviation of the municipalities by the BCC model are close to each other and smaller than the one generated by the CCR model.
Table 6 – Basic Normalized Compound Efficiency statistics per municipality, in percentages
|
Model |
Municipality |
Average |
Standard Deviation |
Confidence interval of 95% to the average |
Minimum |
Maximum |
|
|
inferior |
superior |
||||||
|
CCR |
Marabá |
64,99% |
28,78% |
45,65% |
84,32% |
22,00% |
100,00% |
|
Eldorado dos Carajás |
47,09% |
30,08% |
25,57% |
68,61% |
16,00% |
99,00% |
|
|
Marabá |
69,55% |
24,06% |
53,39% |
85,71% |
29,00% |
100,00% |
|
|
BCC |
Eldorado dos Carajás |
50,00% |
24,88% |
32,20% |
67,80% |
19,00% |
96,00% |
Source: Research results
The results of Table 7 show that at the level of 5.0% of statistical significance there is not any difference in the average efficiency between the municipalities in the CCR model, as in the case of the CCR model the p_value was 0.180, higher than the value established as significant, which led to the non-rejection of the hypothesis that the averages between the two municipalities are equal. In the case of the BCC model, there is a statistical difference between the municipalities at the level of 10% of significance, with a value of 0.083. Consequently, the average efficiency of the companies located in Marabá is higher than the companies located in Eldorado of Carajás.
Table 7 – Analisys of Variance (ANOVA) related to the comparison of effeciency rate of each municipality
|
Model |
Sum of the Squares |
gl |
Average Square |
F |
Sig, |
|
|
CCR |
Entre Grupos |
0,168 |
1 |
0,168 |
1,941 |
0,180 |
|
Nos grupos |
1,643 |
19 |
0,086 |
|||
|
Total |
1,810 |
20 |
||||
|
BCC |
Entre Grupos |
0,200 |
1 |
0,200 |
3,349 |
0,083 |
|
Nos grupos |
1,136 |
19 |
0,060 |
|||
|
Total |
1,336 |
20 |
||||
Source: Research results
The results of the DEA method applied to the data from the companies in the two municipalities show that the BCC model is the one that better expresses the level of relative efficiency among the companies and identifies how much each company should use of inputs to eliminate inefficiency and increase productivity with gains in scale. The application of the DEA that was directed to the input, made by Fernandes, Minori and Morais (2017), aiming to determine the relative efficiency rates of the industrial subsectors of the Industrial Pole of Manaus in 2010 and 2014, indicated that the BCC model presents the best level of relative efficiency using the real (Brazilian currency) and as input variables the input expenses and the annual average of the workers that are employed in the subsectors. The results of this research corroborate with the findings of the application in the red ceramics industry by employing equivalent input and output variables and by using the same models and orientations of the DEA concerning the input.
5. CONCLUSION
The objective of this work was to conduct an empirical study on the efficiency and effectiveness of the processes of some companies in the ceramic sector, located in the region of Carajás, in the state of Pará, in 2015. In this regard, the Data Envelopment Analysis - DEA, for being an important instrument of analysis of the performance of the Decision-Making Units (DMU), being a relevant factor in the support to the decision-making process.
As a way to evaluate the performance of the companies, the classic models CCR and BCC directed to the input were applied. The results show that the BCC model better responds to the calculation of efficiency, and it shows that the “number of suppliers” variable is the one that best discriminates the efficiency between companies, followed by the price of the main feedstock, in this case, clay. The “number of employees” variable has a high gap and weights that are very close to zero. In the practical view of this study, it allowed to point out which resources used by these companies are being significant in their results and which ones need to be reassessed and better managed.
We identified the productive units that act as benchmarks for the companies with the worst levels of efficiency. From them, the managers can establish new strategies or productive processes, by adjusting the level of inputs to the expected results of products according to the level of clearance of each variables used in the model. In terms of the efficiency of the companies by municipality, those located in Marabá have a higher level of average efficiency compared to the level of efficiency registered by the companies in the municipality of Eldorado dos Carajás. This statistic difference is significant for the case of BCC model application at a 10.0% probability level, because the p value was 0.083.
Therefore, with the use of this method, it is possible to contribute to the opening and incentive of new companies from the ceramic sector that can boost the development of the State. For new researches, it is proposed the application of the method directed to the output, in order to make these or other companies to be aware that what they are generating as a product make their processes efficient and collaborate to achieve their goals and a good market performance.
6. ACKNOWLEDGMENTS
We thank CNPQ for the financial support that was received as bursaries.
7. REFERENCES
ABDI - Agência Brasileira de Desenvolvimento Industrial, ESTUDO TÉCNICO SETORIAL DA CERÂMICA VERMELHA, 2016.
ANDRÉ, B. S.; RODRIGO, R. R. F.; WELLINGTON, G. Mapeamento e análise bibliométrica da utilização da Análise Envoltória de Dados (DEA) em estudos de engenharia de produção. Brazilian Journal of Production Engineering, v.4, n.1, 2018.
ANGULO MEZA, L.; BIONDI NETO, L.; MELLO, J. C. C. B. S.; GOMES, E. G. ISYDS– Integrated System for Decision Support (SIAD – Sistema Integrado de Apoio a Decisão): a software package for data envelopment analysis model, Pesquisa Operacional, v.25, n.3, p. 493-503, 2005.
ÂNGULO MEZA, L.; GOMES, E.G.; BIONDI NETO, L.; COELHO, P. H. G.; Avaliação do Ensino nos cursos de pós-graduação em engenharia: um enfoque quantitativo de avaliação em conjunto, Engevista, Niterói, v..5, n.9, p.41-49, 2003.
ANICER. Associação Nacional da Indústria Cerâmica. Relatório anual 2015. Disponível em: <https://www.anicer.com.br/wp-content/uploads/2016/11/relatorio_2015.pdf> Acesso em 29 Jul, 2018.
ANICER. Associação Nacional da Indústria Cerâmica. Relatório setorial 2018. Disponível em: < https://www.anicer.com.br/psq/relatorio-setorial/> Acesso em 29 Jul, 2018.
BARBOSA, S. L. et al. Avaliação da eficiência Docente em um Programa de Pós Graduação Stricto Sensu na Região Sul do Brasil com o uso de Data Envelopment Analysis – DEA, In: XXXI Encontro da ANPAD, Rio de Janeiro, RJ, 2007.
BERTOLOTO, R. F.; MELLO, J. C. C. B. Eficiência de portos e terminais privativos brasileiros com características distintas, Journal of Transport Literature, v.5, n.2, p. 4-21, 2011.
BYRNS, R. T.; STONE, G. W. Microeconomia, São Paulo: Makron Books, 1996.
CALVAIGNAC, L.; PETIOT, R. A quarter century of Data Envelopment Analysis applied to the transport sector: A bibliometric analysis. Socio- Economic Planning Sciences, v. 57, p. 84-94, 2017.
CHARNES, A.; COOPER, W. W.; RHODES, E. Measuring the efficiency of decision making units, European Journal of Operational Research, v.2, p.429-444, 1978.
COOPER, W.; SEIFORD, L.; TONE, K. Data Envelopment Analysis: a comprehensive text with models, applications, references and DEASolver software, Massachusettes: Kluwer Academic Publishers, 2000.
DOUMPOS, M.; COHEN, S. Applying data envelopment analysis on accounting data to assess and optimize the efficiency of Greek local governments, Omega International Journal of Management Science, v.46, p.74- 85, 2014.
ENTANI, T.; MAEDA, Y.; TANAKA, H, Dual Models of Interval DEA and its extensions to interval data, European Journal of Operational Research, 136, 2002.
FAPESPA - Fundação Amazônia de Amparo a Estudos e Pesquisas, Relatório do PIB Municipal 2017.
FARRELL, M, The measurement of productive efficiency, Journal of the Royal Statistical Society, v.120, n.3, p.253-281, 1957.
FERNANDES, A. F.; MINORI, A. M.; MORAIS, R. N. Análise Envoltória de Dados: Uma aplicação no Polo de Industrial de Manaus (PIM). Congresso Internacional de Administração. Adm2017. Ponta Grossa – PR. 2017.
FERREIRA, C. M.; GOMES, A. P. Introdução à Análise Envoltória de Dados, Teoria, modelos e aplicações, 1,ed, 1, Reimpressão, Viçosa, MG: Editora UFV, 2012.
FØRSUND, F. R.; HJALMARSSON, L. Generalized Farrel measures of efficiency: an application to milk processing in Swedish dairy plants, Economic Journal, v. 89, p. 294-315, 1979.
FREITAS, A. P.; GUTERRES, M. X.; LAMPERT, V. N.; SILVAS, A. H. S.; BARCELLOS, J. O. J. Aplicação de metodos de seleção de variáveis em um modelo DEA na produção de bovinos de corte. Engevista, v. 19, n. 4, p. 881-889, 2017.
GARCIA, B. T. G.; SILVA, M. A. V.; FREITAS, M. A. V. Análise da eficiência na geração de resíduos nos terminais portuários de carga geral utilizando DEA. Revista Produção e Desenvolvimento, v.3, n.1, p.60-79, jan./abr., 2017.
GIACOMELLO, C. P.; OLIVEIRA, R. L. Análise envoltória de dados (DEA): uma proposta para avaliação de desempenho de unidades acadêmicas de uma universidade. Revistas GUAL, Florianópolis, v. 7, n. 2, p. 130-151, 2014.
GOMES, S. C.; CHAVES, T. A.; NEGRÂO, K. R. M.; CABRAL, E. R. Análise da Eficiência na Gestão Pública dos Municípios Mineradores da Região Norte do Brasil: uma Aplicação de Análise Envoltória de Dados (DEA), Revista de Administração e Negócios da Amazônia, v.7, n.1, 2015.
GOMES, S. C.; NEGRÂO, K. R. M.; CARVALHO, M. C. S.; CABRAL, E. R. Índice de Desempenho Competitivo das empresas do Arranjo Produtivo Local embrionário de Cerâmica Vermelha na Região do Carajás/PA, Revista Espacios, v.37, n.24, 2016.
GUEDES, L. E. M.; PENA, R. C. M.; GUERREIRO, A. S, Análise de Eficiência dos Terminais Portuários do Mercosul, XXII ANPET, p. 319–330, 2008.
INT - INSTITUTO NACIONAL DE TECNOLOGIA (2012). Panorama da Indústria de Cerâmica Vermelha no Brasil, Disponível em: http://redladrilleras,net/documentos_galeria/PANORAMA%20DA%20INDUSTRIA%20DE%20CERAMICA,pdf, Acesso em: 25/12/2017.
LINS, M. P. E.; ALMEIDA, B. F.; BARTHOLO JÚNIOR, R. Avaliação de desempenho na pós-graduação utilizando a análise envoltória de dados: O caso da Engenharia de Produção, RBPG – Revista Brasileira de Pós-Graduação, v.1, n1, p.41-56, 2004.
MELLO, J. C. C. B. S. et al. Análise de envoltória de dados no estudo da eficiência e dos benchmarks para companhias aéreas brasileiras, Pesquisa Operacional, v. 23, n. 2, p.324-345, 2003.
MELLO, J. C. C. B. S.; ÂNGELO MEZA, L.; GOMES, E. G.; BIONDI NETO, L. Curso de Análise Envoltória de Dados, In: XXXVII SIMPÓSIO BRASILEIRO DE PESQUISA OPERACIONAL - SBPO, Gramado - RS, 2005.
NEGRÃO, K. R. M. et al. Análise de potenciais arranjos produtivos locais de cerâmica e desenvolvimento local: uma aplicação do índice de concentração normalizado, Navus, Florianópolis, v.5, n.4, p.6-20, 2015.
NEVES JÚNIOR, I. J.; MOREIRA, S. A.; MENDES, F.. Estudo Exploratório da Fronteira de Eficiência do Indicador de Alavancagem Financeira em Empresas do Setor Telecomunicações a partir da Análise Envoltória 33 de Dados (DEA), 2010, Disponível em: <http://www,iapuco,org,ar/trabajos/2010/mercosur/A036,pdf>, Acesso em: 3 Jan, 2018.
OLIVEIRA, R. S. L. P.; PEDRO, M. I. C.; MARQUES, R. D. R. C. Avaliação da Eficiência das Empresas Hoteleiras do Algarve pela Metodologia de Análise Envoltória de Dados (DEA), Revista Brasileira de Gestão de Negócios, v.17, p.788-805, 2015.
PARTE-ESTEBAN, L.; ALBERCA-OLIVER, P. Determinants of technical efficiency in the Spanish hotel industry: regional and corporate performance factors, Journal Current Issues in Tourism, v.18, 2015.
PEÑA, C. R. Um modelo de avaliação da eficiência da administração pública através do método análise envoltória de dados (DEA), Revista de Administração Contemporânea, Rio de Janeiro, v.12, n.1, p. 83-106, 2008.
RAIS. Relação anual de informações sociais. 2016. Disponível em: <http://bi.mte.gov.br/scripts10/dardoweb.cgi>. Acesso em 31 Jul, 2018.
REBELO, S.; F. MATIAS, F.; CARRASCO P. Aplicação da metodologia DEA na análise da eficiência do setor hoteleiro português: uma análise aplicada às regiões portuguesas. Tourism & Management Studies, v.9, n.2, 2013.
SANDRONI, P. Novíssimo Dicionário de Economia, São Paulo, 10ª Ed, Editora Best Seller, 2002.
SANTOS, A. B.; SPROESSER, R. L. Caracterização e avaliação da eficiência dos terminais intermodais brasileiros, Gestão & Regionalidade, v.29, n.87, p.47-63, 2013.
SEBRAE. Boletim de inteligência da construção civil. Brasília: SEBRAE, 2015. Disponível em: <http://www.bibliotecas.sebrae.com.br/chronus/ARQUIVOS_CHRONUS/bds/bds.nsf/b877f9b38e787b32594c8b6e5c39b244/$File/5846.pdf> Acesso em 29 Jul, 2018.
VASCONCELOS, M.E.S.S.; HORA, H.R.M.; ERTHAL JÚNIOR, M. Produção científica dos programas de pós-graduação: avaliação da eficiência da área engenharias III. Revista Produção e Desenvolvimento, v.2, n.2, p.11-25, mai./ago., 2016.
YAMADA, Y.; MATUI, T.; SUGIYAMA, M. New analysis of efficiency based on DEA, Journal of the Operations Research Society of Japan, v.37, n.2, 1994.
![]() This
work is licensed under a Creative Commons Attribution 4.0 International
License.
This
work is licensed under a Creative Commons Attribution 4.0 International
License.