Revista Produção e Desenvolvimento, v.4, n.3, p.42-61, 2018
DOI: https://doi.org/10.32358/rpd.2018.v4.296
IDENTIFICATION OF POLYCENTRIC STRUCTURES IN RIO DE JANEIRO WITH FLOW DATA FROM THE METRO SYSTEM
|
Pedro Dias Geaquinto1*; José Brandão Paiva Neto1 and Rômulo Dante Orrico Filho1
1 Transport Engineering Program, COPPE / UFRJ, 21941-914, Rio de Janeiro-RJ, Brazil
|
|
Manuscript received 3/3/2018 and accepted 19/05/2018 |
ABSTRACT
The development of the urbanisation process highlights the decentralisation phenomenon experienced markedly by metropolitan areas. Within its metropolitan area, Rio de Janeiro’s central area, has been, historically, the most established region, and it has also had the highest share of jobs. Nevertheless, it shares its lead with another development centres. Despite that, regional urban planning has devoted little attention to the emerging subcentres, creating a mismatch that results in unnecessary trips, high average travel times, and high occupancy rates within vehicles. Also, an incorrect match between functional centres represents restraints to their economic development. Therefore, this paper aims to contribute to better understand the subcentre structure by means of analysing the trip patterns of the Rio de Janeiro’s metro network. This study is based on an exploratory analysis of O-D matrices which were built with metro passengers in and out data. Results point to the emergence of new centres outside the CBD, and they also suggest that transit performance has not been able to keep up with these tendencies, creating severe operational issues.
|
KEYWORDS: centrality, network design, Rio de Janeiro. |
IDENTIFICAÇÃO DE ESTRUTURAS POLICÊNTRICAS NO RIO DE JANEIRO COM DADOS DO SISTEMA DE METRÔ
RESUMO
O avanço dos processos de urbanização torna notável o processo de descentralização pelo qual passam sobretudo as regiões metropolitanas. A região central da cidade do Rio de Janeiro, embora seja, historicamente, a mais consolidada, com a maior parte dos empregos de sua Região Metropolitana, dividiria esse protagonismo com outros polos de desenvolvimento fora da área central. Ainda assim, o planejamento parece dedicar pouca atenção aos subcentros emergentes, gerando um descompasso que resulta em deslocamentos desnecessários, em altas médias de tempo de deslocamento e em altas taxas de ocupação nos veículos. Outrossim, uma articulação incorreta entre os centros funcionais representa um impedimento ao seu desenvolvimento econômico. Assim, este artigo visa contribuir à compreensão da estrutura de centralidade a partir do perfil dos deslocamentos internos à rede metroviária do Rio de Janeiro. Este estudo se alicerça na análise exploratória das matrizes de origem e destino relativas a entradas e saídas, por estação de metrô. Os resultados indicam que polaridades distintas da área central de negócios emergem e que o desempenho da rede de transportes ficou aquém dessas tendências, gerando problemas operacionais graves.
|
PALAVRAS-CHAVE: centralidades, desenho de rede, Rio de Janeiro. |
1. INTRODUCTION
Since prior urbanization, following up to the blossoming Industrial Age, high transport costs for passengers, cargo and information, at both regional and intraurban scale, favoured the rise of a monocentric world (BOSERUP, 1981a, 1981b; PACIONE, 2009; VUČIĆ, 2007a). Cities were established at or around transportation hubs such as ports and trade route crossings. For these places present the best conditions to receive and distribute production inputs. The growing settlements became ever more attractive to workers in search of employment, which led to population growth and specialised districts (ANAS; ARNOTT; SMALL, 1998). However, beginning on the mid-nineteenth century and especially throughout the twentieth century, researchers pointed to a process common to many urban areas – the main city centres lost part of their dominance, due to the increasing number of multiple centralities.
The advent of the railways severed the close relationship between home and work: if longer distances could be covered in less time, one could access land which was cheaper and farther away, while maintain his or her job connections. Thus, the suburbs had their way paved towards expansion: workers and population moved away from the city centre, as they settled along railways and crowded around train stations. In that scenario, firms and industries experience a reduced competition for space in the central area and thus increase their dominance over it, to take advantage of agglomeration economies. The result is that the central district takes a stronger role as the dominant pole (LEVINSON, 2008; NEWMAN; KENWORTHY, 1996).
The decentralisation of economic activity gained momentum with the housing choices of families with small children, which were the predominant household archetype of the 1960s and 1970s in most developed countries. This household type was numerous due to the baby boom at the end of World War II. They usually preferred more spacious homes in cheaper areas with low population density, such as suburbs and smaller settlements. Such arrangement was seen as more suitable for bringing up children (CHAMPION, 2001). This process was a reaction to the diseconomies of large urban centres, such as high land value, pollution, property damages, outdated housing stock and "congestion costs". These negative aspects sometimes exceed the benefits of spatial agglomeration (FERNÁNDEZ-MALDONADO et al., 2014). Therefore, relocation trends of economic activities at decentralised concentrations are caused by tension between economies and diseconomies of agglomeration and are theoretically understood as an outcome of multiple equilibria (ASIKHIA; NKEKI, 2013; FERNÁNDEZ-MALDONADO et al., 2014; LIN; ALLAN; CUI, 2015; SINCLAIR-SMITH, 2015; SINCLAIR-SMITH; TUROK, 2012).
Unlike very hierarchical monocentric urban structures, polycentric conformations are associated with strong functional interconnections and complex travel patterns between specialized and interdependent centres (LIMTANAKOOL; DIJST; SCHWANEN, 2007; LIMTANAKOOL; SCHWANEN; DIJST, 2009; SINCLAIR-SMITH; TUROK, 2012). Two versions of polycentric urban configurations are characterized. On the one hand, the European configuration is characterized by networks of cities (e.g. Randstad, the Netherlands), without necessarily a dominance relation (LIMTANAKOOL; SCHWANEN; DIJST, 2009). On the other hand, the North American context: a scattered city whose subcentres rival the historical centre, where there is a clear hierarchical relationship in which the original central area is dominant (CHAMPION, 2001). In that context, the Latin American regions are typically similar to the North American way, since they showed a rapid expansion of residential suburbs, which led to a dispersion of productive centres (FERNÁNDEZ-MALDONADO et al., 2014; ORRICO FILHO et al., 2015). It is worth noting that interactions at different scales are not mutually exclusive and might co-exist in complex agglomerations: notable examples are the Rhine-Ruhr region in Germany and the Boston-Washington megalopolis in the United States (CHAMPION, 2001).
In developing countries, there is a marked decentralisation process, although their cities still retain part of their relative monocentric profile because of their peculiarities. For unlike most developed countries, the industrial sector has not ceased to be a large employer and there is a higher proportion of poor people in the population. As result, the use of cars is reduced, and cities are more compact than North American ones. One reason for that is that cities in developing countries are oriented toward short distance transportation modes, such as walking (ASIKHIA; NKEKI, 2013; FERNÁNDEZ-MALDONADO et al., 2014; NEWMAN; KENWORTHY, 1996).
This paper refers to the Rio de Janeiro central area, the most consolidated part of the city, which historically concentrates most of the jobs of the metropolitan region (IETS, 2016). Despite that, the state capital counts with other development poles outside its core area. As pointed out by Duarte (1974), Rio de Janeiro city would consist of intraurban centres, which subordinate in hierarchy to the central area. Urban and population growth produce dense settlements in areas far away from the main centre. This results in a larger share of trips towards the city centre, thus increasing traffic congestion. This situation is made worse by the bottlenecks imposed by the city’s topography on the road network. If going the main centre is too costly, there is a proper scenario to the proliferation of "alternative sites". Indeed, at places with favourable infrastructure, i.e. where alongside a large consumer population there are convergent transport lines or major transportation axis of mandatory passage, there emerge functional centres (DUARTE, 1974, p. 59). More recent studies, such as IETS (2016), ultimately identify the same centres as Duarte (1974), although using different methodologies.
Even though the literature points to a major shift in the centralities structure, urban planning seems to insist on improving access to the centre of Rio de Janeiro, while devoting little attention to subcentres – cf. section 2.3. Clark (1958) already pointed to the decision makers’ insistence to solve old problems that are no longer relevant. Orrico Filho et al. (2013) discuss the reluctance of governments to recognize the existence of new centres. The explications for this, according to the authors range from ignorance to prejudice. In this sense, the metropolitan transportation network is almost entirely radial: few arterial roads, such as the Yellow Line, do not converge to the central area and all rail systems can be accessed in this region. A mismatch between the transportation network and centralities structure may result in unnecessary travel, i.e. not only average travel time is high but there are high occupancy rates, as there is an unnecessary mix between flows: passengers travelling to the centre crowd together with those who merely want to pass by. Also, an incorrect connection between functional centres is both a barrier to economic development and a hindrance to an improvement in role played by these centres the territorial economic dynamics.
Therefore, as people’s displacement conditions dictate the shaping of the intraurban space (VILLAÇA, 1998, p.333), the first objective of this paper is to contribute to the understanding of centralities structures, its case study is the passenger flow of the Rio de Janeiro’s metro system. The second objective is to discuss the suitability of the city’s current and planned structural lines, based on the implications of the O-D matrix of metro stations.
Unlike several studies aimed at identifying centres based on the amount and concentration of jobs (ALIDADI; DADASHPOOR, 2017; FERNÁNDEZ-MALDONADO et al., 2014), this study aims at assessing the functional relations of the available data by means of identifying the greater flows of the O-D matrix. Therefore, functional centres may be identified, in contrast to the traditional approach of morphological assessment. In this sense, the categorization was made by using the amount of travel between O-D pairs in the morning and evening peaks. Then, the paper identified not only critical areas but also stations which are the biggest polarizing points of the flows internal to the metro network. The degree of decentralization revealed by the pattern of travel flows reveals problems of the studied network, which are often exacerbated by the historical guidelines of planning. The paper also contributes to a critical analysis of the relevance of proposed network expansion projects. Measures of urban structure are essential to support spatial planning policies (CATS; WANG; ZHAO, 2015).
This article is divided into six parts. The next section provides a literature review on polycentricity and on approaches which aim to identify the urban structure. Next, there is an overview of the historical and geographical evolution of the study area, and the current – and planned – Rio de Janeiro’s transportation network are presented. The fourth section explains the database and the methods used to enable the proposed analysis. Next, the results of the analysis are presented, as well as the reflections raised by them. The sixth section brings the concluding remarks and suggestions for future work. Lastly, the consulted references.
2. LITERATURE REVIEW
Social, economic and administrative activities tend to concentrate on the point that minimizes the time, the costs and the distress associated with human displacements. Indeed, the main centre is the point of greater accessibility to the rest of the territory. It represents a better appropriation of the work consolidated on the production of the urban agglomeration. The centre is also the place where one has the greater access to the labour put together by the agglomeration itself. The subcentres, in turn, are hierarchically smaller versions of the main centre, as they serve not to the entire agglomeration, but the only parts of it (PACIONE, 2009; VILLAÇA, 1998).
Therefore, by definition, the formation of centres and the urban evolution of a metropolis are processes entwined to changes in the displacement conditions throughout the territory. In effect, this has certain implications for planning. For instance, Cervero (2003) showed empirically that infrastructure expansion, specifically when aimed at individual modes, creates vicious cycles of congestion problems due, partly, to the stimulation of long term land use developments. Derrible and Kennedy (2010) have shown that design and operational characteristics of the transportation networks may promote certain kinds of offsets – e.g. the smaller the number of stops, the higher is the conditioning for long trips, rather than short.
Two approaches are prominent in the identification of urban structure: morphological and functional. The morphological approach states that a given region is polycentric when there is a balanced distribution centres in terms of size and geographical distance. For the functional approach the more balanced the flow distribution, the more polycentric a region is (cf. GRUNFELDER; NIELSEN; GROTH, 2015).
Morphological studies often seek job clusters, which are revealed either by density gradients of the total number of jobs, either by quantitative measurements or parametric calibration of synthetic models (ALIDADI; DADASHPOOR, 2017; ANAS; ARNOTT; SMALL, 1998). Although recent studies still use such approaches (ALIDADI; DADASHPOOR, 2017; FERNÁNDEZ-MALDONADO et al., 2014), a dense, diverse and complementary tertiary sector would best reveal urban centres (VILLAÇA, 1998). Indeed, there are studies which add a diversity factor to the indicators of job density (ESCAMILLA; COS; CÁRDENAS, 2016). There are also studies that focus on recognizing the capacity of specific aspects as proxies of centrality, as opposed to traditional elements, e.g. Zambon et al. (2017) measures urban centrality based on local-scale diversity in soil sealing levels. It should be pointed out that any morphological analysis may contain theoretical constructs and more sophisticated tools to support more comprehensive evaluations of urban form, such is the case of Shen e Karimi (2017), who performed a longitudinal analysis, and of Zemp et al. (2011), who verified the performance of a transportation network within an interaction framework.
A limitation of the morphological is that it is restricted to a static representation that does not consider the movement and exchange of people, goods and information between centres (CATS; WANG; ZHAO, 2015). If morphological studies identify urban arrangements able to attract and retain travel (cf. ESCAMILLA; COS; CÁRDENAS, 2016), they act as proxies for the movement of people within a given urban area. Therefore, studying the flows directly should also reveal the centralities structure. Zhang, Zhou and Zhang (2017) show that the land use mix may approximately represent the transport system performance, but at the same time this relation is suboptimal and not easily modelled.
In that regard, one may identify a centre by investigating the amount of travel attracted to a given area (cf. ROTH et al., 2011) and, additionally, by means of the diversity associated with this flow, whether in terms of travel purpose (ZHONG et al., 2017), whether in terms of its socio-economic composition (MARMOLEJO; TRONCOSO, 2017). Kraft and Marada (2017) support this reasoning and criticize the exclusive monitoring of work trips. They outline that other flows, such as commute to school, are highly correlated with performance in their case study.
Zemp et al. (2011) report that, contrary to comprehensive approaches of urban areas, studies concerning public transport stations usually give greater priority to functional aspects, such as passenger frequency. They stress that classifying stations based solely the density of use undermines contexts which are relevant to an integrated land use planning. Cats, Wang and Zhao (2015) point out that the relative difference between a zone’s inflow and outflow is useful to their classification. They also emphasise that a high travel concentration may not necessarily mean a central place, but rather an integration hub. Therefore, as systematized by (LIMTANAKOOL; DIJST; SCHWANEN, 2007; LIMTANAKOOL; SCHWANEN; DIJST, 2009), passenger flows may constitute a complex spatial interaction relationship, and are better explained in light of different dimensions, such as strength, symmetry and structure.
Although both morphological and functional approaches complement each other, functional integration outpaces morphology when it comes to revealing polycentric and integrated urban areas. Even if morphologically a place is predominantly monocentric, it may present complex travel patterns, i.e. cross and reverse commuting (GRUNFELDER; NIELSEN; GROTH, 2015).
3. THE STUDY AREA
This section consists of three parts. First, a brief description of Rio de Janeiro’s urban growth and of the emergence of its functional centres. Next, a comprehensive view of the city’s public transport network. Lastly, the plans for future expansion of the public transport network are presented.
3.1. Rio urban development
Concerning the urbanization of Rio de Janeiro and the growth of its transportation network, Abreu (2013) identifies two fronts of expansion. First, there are the areas preferred by the high-income classes, which first settled along the axes of the tram system and, later, along the main road system. Second, there are the low-income classes, which gathered along urban rail.
Rio’s railways were first conceived to better and more efficiently transport the outputs of the coffee plantations of the Paraiba Valley (BENCHIMOL, 1990). The railways were first implemented in the northwest direction, where they would not only solve the difficulties of the coffee plantations, but would also better connect Rio de Janeiro with the rest of the country (BENCHIMOL, 1990; VILLAÇA, 1998). As a side effect, urban growth also followed the northwest direction, as the working classes would settle along the tracks and the train stations, in order to better access to the city centre (VILLAÇA, 1998).
The main characters of the urbanization of Rio’s high-income neighbourhoods were the tram companies. They acted together with real state firms, large developers and companies of public services, usually financed by the State. The role of the tram companies, especially in the south zone of the city is indissociable from its construction (BENCHIMOL, 1990). While the Botanical Garden Company favoured the occupation of [Rodrigo de Freitas] Lagoon by the upper classes, the other tram companies would connect to the city’s central area, not only the working-class neighbourhoods of the parishes of Santana and Espírito Santo (Santo Cristo, Gamboa, Saúde, Catumbi), but also the rich neighbourhoods and farmhouses in the North (Tijuca, Andaraí) (ABREU, 2013, p. 45).
This process of segregated urbanization continues thereafter, gaining momentum with increased automobile use. In short, Villaça (1998) points out that Rio de Janeiro’s Atlantic coast has always attracted upper classes, at first because of its milder microclimate and its natural beauty. Later, because of an increased sea bathing desire, as it was associated with the modern times. In effect, the areas closer to sea became the preferential places for the high-income neighbourhoods. As densification took place, and city centre became ever more distant for a greater population, the concentration of subcentres emerged. The farther regions to the North and the West, especially along the railway tracks, were left for the working classes. The densification of these latter areas also induced the formation of subcentres, which aimed at catering for the needs of that social stratum.
Some of the seminal works that attempted to identify these subcentres consisted of morphological approaches that measured the degree of concentration of economic activity, based on the density of firms in the tertiary sector (e.g. DUARTE, 1974; KOSSMANN; RIBEIRO, 1984). More recent studies are more functional in character, as they incorporate the intraurban flows of people in the construction of their indicators (e.g. IETS, 2016; RIO DE JANEIRO, 2014).
3.2. Current transport system
The city’s rapid transit network is a spanning tree graph – Figure 1. The rail services are operated by means of concession contracts, which were granted to two private companies in the late 1990s, following calls to tender: MetrôRio operates the metro system, while SuperVia runs the urban rail. The lack of interconnections and different feeder systems prevent a potential interoperability between the metro system and the urban rail. On possible reason for this was. One possible reason for this was pointed out by Guedes (2014), who argues that the choice for a metro system was not the product of the assessment of different alternatives, that it emerged as an end in itself, detached from a network logic. The rapid transit network is presented in Figure 2.
Up until 2009, the metro system consisted of two lines: Line 1, which connected Tijuca neighbourhood, the Centre and the South Zone, and Line 2, which crosses the northern zone, from Pavuna to Estácio station (ESA). The latter used to be the only place where it was possible to change between Lines. From 2009 onwards, a by-pass between São Cristóvão (SCR) and Central (CTR) allowed a direct connection between Line 2’s terminal station, Pavuna (PVN), and Botafogo (BTF) station in the South Zone. In effect, MetrôRio began the joint operation of two radial routes – Pavuna x Botafogo and Saens Peña (SPN) x General Osório (IGO) – that shared tracks in the section between Central and Botafogo stations.
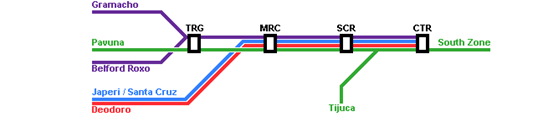
Figure 1 - Scheme of Rio de Janeiro’s radial system between Triagem and Central
Source: Authors
Since 2009, there have been three important interventions. The first was the inauguration of Uruguai station at the north end of Line 1. The second was the construction of Line 4, which connects General Osório to Jardim Oceânico, at Barra da Tijuca neighbourhood of southwestern Rio, while crossing Leblon and São Conrado. Since Line 4 is indeed an extension of Line 1, both names have been commercially adopted and are used interchangeably. The third intervention refers to the special operations on Line 2: the pre-2009 route is operated on holidays and weekends, and in the happenstance of major events, it may connect Pavuna to General Osório or Jardim Oceânico directly.
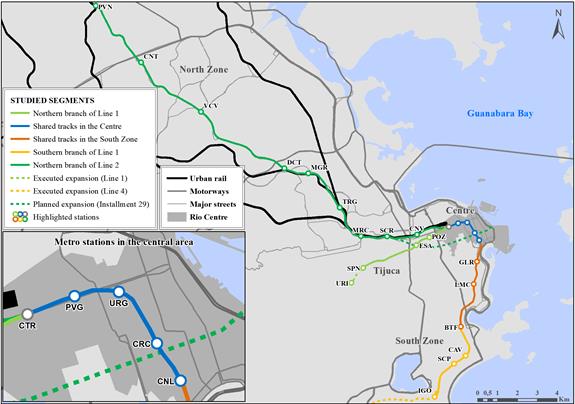
Figure 2 - Outline of the rapid transit system, relevant stations highlighted
Source: Authors
3.3. Future scenarios
Together with the tramway and new bike lanes, a paradigm shift is expected on the displacements internal to the central region. By the end of 2015, Rio’s City Hall started to rationalise the bus routes linked to the South Zone, to reduce the idleness of the municipal fleet. This reflects a reorganization trend in the city’s bus system, which started with the implementation of both shared and segregated bus corridors (BRS and BRT, respectively). Out of the four planned BRT corridors, only one links directly with the City Centre, the TransBrasil corridor, which proposes to replace most of the lines running along the Brasil Avenue. In effect, such corridor promotes a new segregated radial connection (SYSTRA-SETEPLA, 2011).
The rapid transit system also undergoes reformulations. Since 2012, SuperVia added capacity to their system, as they installed a new signalling system that allows for 3-minute headways. Likewise, the Greater Rio de Janeiro Transport Plan aims for considerable changes on the metro system. There are plans to connect the Gávea neighbourhood to the City Centre (an extension of Line 4); to link São Gonçalo, Niterói and Rio de Janeiro’s central area (Line 3), an initiative that would include an underwater tunnel across Guanabara Bay; and, finally, to implement the so called Instalment 29, which is an extension of the pre-2009 Line 2 towards Praça XV (HALCROW-SINERGIA-SETEPLA, 2016).
One should note that, in effect, these plans generally consist of radial expansions. Such practices should be seen with caution, as this type of connection favours the exaggerated dominance that Rio’s central area exerts over the metropolitan area. Instead, there should be policies to connect the subcentres to each other and to their surroundings, in order to promote a more balanced economic development (QUANTA-LERNER, 2017, p. 16).
4. MATERIALS AND METHODS
The reference database for this analysis was collected by MetrôRio for the demand studies for Line 4 – refer to section 3.2. It consists of origin-destination (O-D) matrices relating the inflows and outflows of each metro station, during three peak periods – morning, noon and evening – of a typical business day (FGV, 2012). The analysis considered only the morning and evening peaks, lasting three hours each. Additionally, the analysis considered that the peak hour presents an occupancy rate 20% higher than the average for the three-hour period.
The paper evaluates the origins of inflows and destinations of outflows of metro stations, in order to reveal the most frequently referenced places within the flows of each station, which should coincide with dominant areas. In other words, the more a given station polarises passenger flows, the more likely it is a travel pole. The data visualisation is based on the classification of the flows according five percentage ranges: the lower threshold of percentages below 1%, which represents negligible flows; the upper threshold of percentages above 20%, which revealed about 25 O-D pairs per matrix; the range between 12% to 20%, which outlined about 50 O-D pairs per matrix; the range between 7% and 12%, which highlighted about 100 O-D pairs per matrix; and the remaining range between 1% and 7%, which represents prosaic flows. This scheme produced Figures 3, 4, 5 and 6.
Following this travel distribution analysis, an assessment of critical sections in terms of service is performed, in order to determine the stations in the system which are the most functional. Travel allocation and the making of occupancy histograms is rather straightforward, because, since the Rio de Janeiro metro network is a spanning tree graph, there is only one possible path between each origin-destination pair. Transfers in the shared tracks section were not considered, since passenger share between Line 1 and Line 2 is not part of the scope of this paper. Displacements consisting of redundant routing were also considered insignificant.
The metro network was divided into the 5 segments shown in Figure 2: L1N (light green) – the northern branch of Line 1 (Saens Peña x Praça Onze); TCC (blue) – the shared tracks in the central area (Central x Cinelândia); TCS (orange) – the shared tracks in the South Zone (Glória x Botafogo); L1S (yellow) – the southern branch of Line 1 (Cardeal Arcoverde x General Osório); L2N (dark green) – the northern branch of Line 2 (Pavuna x Cidade Nova). The Central station (in grey) was analysed with greater scrutiny. This station not only plays an important role as a place of intermodal interchange, but it is also a common node between Lines 1 and 2, and the urban rail.
In short, the first study evaluates the travel profile at boarding and alighting points, in order to reveal travel generation poles, which should coincide with the location of urban centralities (CATS; WANG; ZHAO, 2015; ROTH et al., 2011). The second study determines the most critical location in the system concerning operational problems, which are revealed by the passenger occupancy histograms. The subsequent analysis highlights that the usual presumption that the strongest morphological centrality is also the dominant functional centre, may not necessarily be true. A failure in such assessment leads to planning deficiencies and an inadequate investment allocation.
5. RESULTS AND DISCUSSION
The central area metro stations stand out as the destinations in the morning and as origins in the evening, but there are other regions with a similar profile. Figures 3 and 4 show that, in the morning, Saens Peña (SPN), Botafogo (BTF), Siqueira Campos (SCP) and General Osório (IGO) stations are prominent attraction points for passenger from the central area. In the evening, the situation reverses – those stations are the largest points of passenger inflow bound towards stations in the central area. Since the population density around the stations in the city centre is no greater than 5000 inhabitants per km² (IBGE, 2011), these trips probably destined elsewhere, which indicates that many people may use these stations to interchange with other modes.
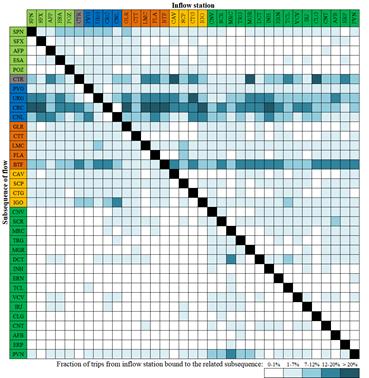
Figure 3 - Destination dominance bound from each station at the morning peak
Source: Authors, adapted from FGV (2012)
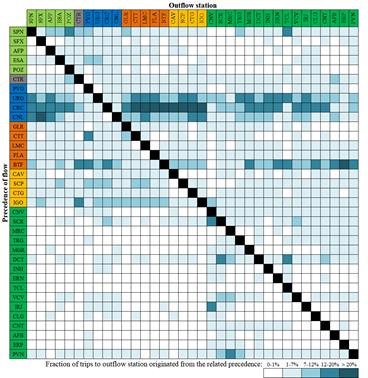
Figure 4 - Origin dominance bound to each station at evening peak
Source: Authors, adapted from FGV (2012)
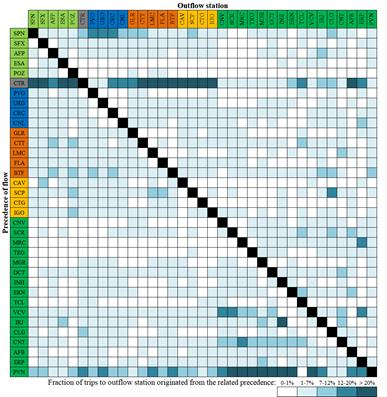
Figure 5 - Origin dominance bound to each station at morning peak
Source: Authors, adapted from FGV (2012)
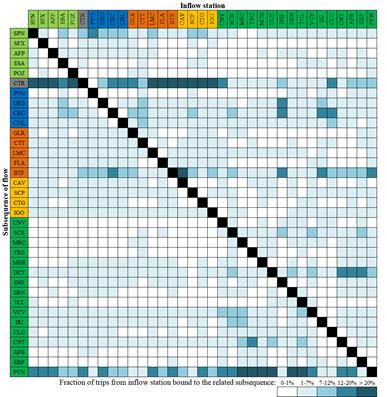
Figure 6 - Destination dominance bound from each station at the evening peak
Source: Authors, adapted from FGV (2012)
The profile of the largest origins in the morning and the largest destinations in the evening bound towards each station – Figures 5 and 6 –, shows the presence of important convergence areas for metro access. Therewith, Central station (CTR) is as an exception in the central area because of its production/attraction ratio, i.e. larger production in the morning and greater attraction in the evening. Roughly 70% of the ridership at the morning peak are inflows and 80% of the ridership at the evening peak are outflows. After all, Central station also serves as access point to other modes. Above all, it is most relevant for the trips related to the socioeconomic activities adjacent to the stations at the CBD (mainly Carioca and Cinelândia), at Tijuca, and at the South Zone.
Other stations also serve as interchange hubs. Pavuna station (PVN), for instance, plays a markedly integrating role for the northern metropolitan area – Figures 5, 6 and 7. Out of all regions served by the metro system, PVN figures amongst the three biggest boarding points in the morning, and it also figures in between the top three alighting points in the evening. Besides, in the morning, it is overcome only by Central station – see Table 1. In particular, Figures 5 and 6 show Pavuna station as an important access to activities adjacent to Line 2, as most O-D pairs formed by PVN and other stations of Line 2 frequently represent percentages above 20%.
Figures 5, 6 and 7 also reveal that stations such as Coelho Neto (CNT), Del Castilho (DCT) and Vicente de Carvalho (VCV) are closely related to the northern branch of Line 2 (L2N). In the morning peak, a marked number of passengers boarding at these stations are bound to L2N, while the reverse behaviour happens at evenings. A possible explanation is that L2N is close to some arterial roads – namely Brasil Avenue and the Yellow Line, two major motorways, and the T-5 corridor, a set of major streets through which TransCarioca BRT line was built, while replacing important bus routes.
This rationale of integration with the adjacencies may also explain the participation of the Botafogo and Saens Peña stations as the major boarding points to Central and South Zones, in the morning. During the evening peak, those stations those stations are major alighting points of the flows originating both in the South and in the Centre, as shown in Figure 7. Additionally, Botafogo and Tijuca are neighbourhoods with a considerable population density by the city standards. They count with a wide range of bus lines, including some with fare integration with the metro system (HALCROW-SINERGIA-SETEPLA, 2012). This role of hub played by the Botafogo station would also explain its large attraction profile, since it is among the largest destinations (in the morning) not only of passengers originating in the city centre’s stations, but also of passengers originating in other regions such as the northern branch of Line 2.
Table 1 - Ridership of the stations with the most production and attraction at peak hours
|
Morning peak |
Evening peak |
||||||
|
Station |
Production (pass./h) |
Station |
Attraction (pass./h) |
Station |
Production (pass./h) |
Station |
Attraction (pass./h) |
|
CTR |
27532 |
CRC |
23048 |
CRC |
23568 |
CTR |
31381 |
|
PVN |
19710 |
BTF |
18853 |
BTF |
18121 |
PVN |
20587 |
|
SPN |
11890 |
URG |
15481 |
URG |
14459 |
BTF |
12827 |
|
BTF |
7544 |
CNL |
13080 |
CNL |
13782 |
SPN |
12691 |
Source: Authors, adapted from FGV (2012)
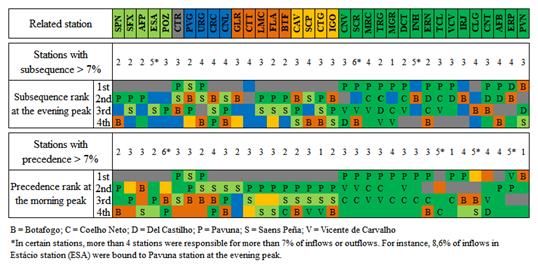
Figure 7 - Stations with most of the inflows in the morning and outflows in the evening for each related station
Source: Authors, adapted from FGV (2012)
The data suggests that Botafogo is the station outside the central region that stands out the most: second largest trip generation observed at both morning and evening peaks. It has a ridership of about 115,000 passengers a day and rivals Carioca station, the system’s second busiest station, with a privileged location within the CBD. However, the ridership of these stations still does not overcome Central station, the system’s busiest, with ridership of about 150,000 passengers per day. This result was expected because of the trend observed since at least 2003 – Figure 8: in 2008, the former busiest station, Saens Peña, was outpaced by the current three busiest stations, and Botafogo’s ridership exceeded Carioca’s by a narrow margin.
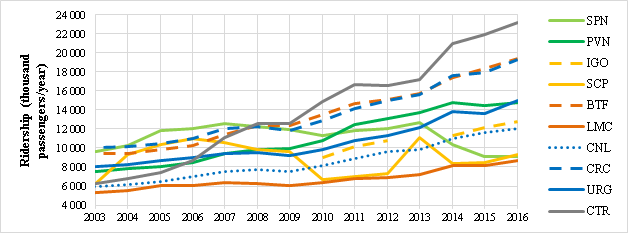
Figure 8 - Evolution of ridership at main stations
Source: Authors, adapted from IPP (2018)
A feature of Botafogo is that, besides being a busy alighting point, it also is an expressive boarding station. About 30% of the ridership at the morning peak concerns inflows and 40% of the ridership at evening concerns outflows. This makes it the fourth largest production in the morning – see Table 1 – and the third largest attraction in the evening. Such balance between attraction and production does not happen in central area stations: except for Central station, more than 75% of their ridership is directly linked to commuting (outflows in the morning and inflows in the evening). The rest of the passenger flows in the central area are most likely intermodal transfers. Therefore, when it comes to performance, Botafogo station would be less mono-functional than its central counterparts – in the framework created by Limtanakool, Dijst and Schwanen (2007), its strength levels are close to the busy central stations, but it is associated with higher levels of symmetry.
5.1. Metro system’s critical area
The most critical location is a section of the northern branch of Line 2, between Maria da Graça (MGR) and Triagem (TRG) stations – Figure 9. The overcrowding happens southbound, during the morning peak, and northbound, at evening. At this critical section the passenger occupancy rate revolves around 7 passengers/m². The recommend maximum limit is of approximately 6 passengers per square meter (VUČIĆ, 2007b, p. 157).
During the three-hour peak periods, both morning and evening, the section between Central and Presidente Vargas stations shows the highest absolute load in the peak direction, roughly 30,000 passengers per hour, which translates into an average occupation close to 6 passenger/m². The Central station is a very delicate point due to its high production in the morning, when it injects 4,000 passengers/h into the peak direction, and to its high attraction in the evening, when it receives a load of 5,900 passengers/h from the peak direction.
Not only Line 2 is the busier route in the section of track sharing, but there is considerable travel generation in the southern portion of the metro system, especially because of Botafogo station. Thus, the next section investigates profile of the trips entering and leaving the shared tracks.
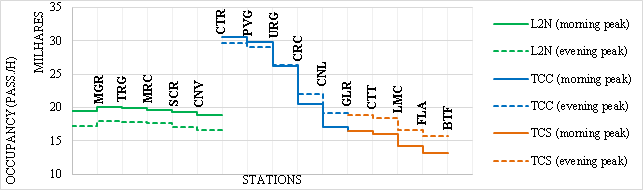
Figure 9 - Passenger occupancy histogram of the peak direction at morning and evening peak hours
Source: Authors, adapted from FGV (2012)
5.2. Travel patterns in the inner city
On the one hand, there are segments in the system whose trips consist mostly of commuting to the city centre (i.e. both to Central station, and to the other stations in the shared track section). For instance, 63% of trips coming from the northern branch of Line 1 (L1N) go to the central area in the morning, whereas 54% of the trips bound towards L1N, in the evening, originate in the central area. In this perspective, L1N is about as tied to the Centre as all other segments of the network combined.
On the other hand, there are portions of the metro system whose commuting behaviour reveals strong ties with the South Zone (i.e. both with the southern branch of Line 1 and with the shared track section in the South). For instance, of all passengers boarding at L1N in the morning, 27% alight in the South, whereas of all passengers bound to L1N, 32% boarded in the South Zone.
Figures 10 and 11 display the commuting flows in the peak direction of Central station (CTR), which is southbound in the morning and northbound in the evening. Thus, it is possible to assess the strength of the connection between the North Zone and the city centre, on the one hand, and between the North and South Zones, on the other. Between 60% and 70% of all trips tied to L1N are bound to the city centre, in the morning, and originate in the central area, in the evening. Slightly more than 50% of the trips tied to the northern branch of Line 2 (L2N), and only 30% of the flows tied to CTR present this commuting association with the CBD stations. Therefore, the metro system is as relevant an access to activities in the South and North Zones that, in some instances, the related flows rival those of the metropolitan centre.
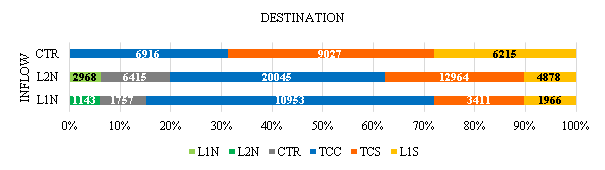
Figure 10 - Destination of southbound shared track inflows at the morning peak
Source: Authors, adapted from FGV (2012)
Figure 12 displays the O-D patterns at Cinelândia station (both leaving and entering the central area, in the morning and in the evening, respectively). Thus, one can analyse the profile of the commuting trips tied to the South Zone, in the peak direction, and in the shared tracks in the central area. Figure 12 implies that South Zone presents a strong functional connection both with L2N and CTR: around 80% of the southbound trips at Cinelândia station come from L2N and CTR, each accounting to roughly 40%. The wide drop (from 42% to 35%) of passengers related to the L2N confirms the smaller use of the line during the evening peak, indicated as well in the histograms of Figure 9.
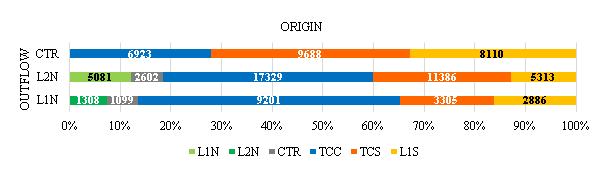
Figure 11 - Origin of northbound shared track outflows at evening peak
Source: Authors, adapted from FGV (2012)
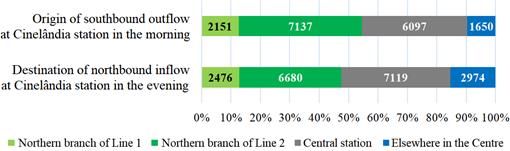
Figure 12 - Passengers per hour at Cinelândia station in the peak direction at morning and evening peak hours
Source: Authors, adapted from FGV (2012)
5.3 Discussion
The results agree with the theoretical framework and, particularly, as noted by Villaça (1998), they suggest that the structure of the urban region is mainly conditioned by the human displacements within it. Indeed, the analysis of passenger flows in the Rio de Janeiro metro system revealed a centrality structure that resonates with more laborious studies (e.g. IETS, 2016; RIO DE JANEIRO, 2014). Furthermore, this paper reinforces the theoretical and empirical argument which states that morphological studies measure the flow of people, since the density of jobs or that of (specialised) services ultimately impact the amount of people attracted to a given area. Therefore, even seemingly simplified approaches that do not require detailed data collection should be able to provide coherent results.
There is an ongoing urban shift, as centralities other than CBD emerge. As a reaction, the performance of the transport network changes and reflects these trends. The case study revealed severe operational problems, and transport planning seems to not be able to cope with new demands. The South Zone has already overcome the stage of emergent subcentre and some places, such as Botafogo, appear to have a metropolitan reach. The ridership tied to these areas generate prominent flows, which are forced into a network directed to CBD. The ultimate result is that diametral flows are mixed with radial flows. Thus, the unhealthy conditions suffered by passengers of L2N in the critical area of the system are made worse.
Forthcoming projects, however, ignore these trends. Transport infrastructures such as TransBrasil BRT Line and even rapid transit projects such as Line 3 and Line 4, reinforce the idea of a radial city that does not exist anymore. Other projects, such as Instalment 29, may be helpful, in the sense that they are able to better organize the current flows, but they remain detached from the urban structure and its evolution.
One of the main goals of Instalment 29 is to serve as an integration line between the metro system and urban rail. The problem is that the proposed interchange region (Triagem x São Cristóvão), as highlighted by this paper, is the most critical stretch of the metro network. Thus, urban rail passengers that would like to transfer into the metro would keep on using the station with the lowest impedance – in this case, Central station would offer less crowded vehicles. The ultimate result would be the ordering of the flows tied to L2N and a better level of service to radial commuters. However, this type of approach is not recommended in the literature, since the expanded capacity can absorb short-term repressed demands and generate indirect long-term demands by stimulating changes in land use (see CERVERO, 2003).
Initiatives like the Porto Maravilha Consortium, which estimates the creation of 700,000 jobs over a 20-year horizon, while projects only 30,000 new inhabitants (TORTORIELLO, PEREIRA, 2013) exacerbate this situation. Other aggravating future factors are the increase of commuters in the region, induced by improvements of the urban rail system, and by the bus route rationalisation, which reduced the connectivity to the South Zone, while placing the burden on the rapid transit services. A more favourable fare condition, such as policies related to the Carioca Integrated Ticket, is enough to increase the expectations for ridership.
The newly inaugurated tramway, on the other hand, increases the supply of local transit in the central region. This may reduce the inflow of passengers into the more regional systems that cross the central area. Increasing metro lines supply for this purpose, is both difficult to implement, and it is a solution whose real effects on the improvement of the level of service is controversial at best (CERVERO, 2003).
A possibly better solution would be a new tangential line to the central area, connecting North and South Zones more directly, while aiming towards the simultaneously connected and direct network model proposed by Derrible and Kennedy (2010). Thus, one could avoid the allocation of transversal trips into radial lines, which would reduce travel time, while reducing the interference with the central area traffic. A possible location is the western fringe of the central region, from Maracanã to Central. This meets existing plans such as the Line 4 extension towards the Centre – i.e. instead of a radial line with an asymmetrical profile, there could be a route with two functional directions. Simpler and cheaper solutions involve a new rationalisation of the southbound bus routes, since new trunk lines through the transversal tunnels (Santa Bárbara and Rebouças) could play the same role, albeit with less capacity.
Therefore, a network design that recognizes changes in land use and, consequently, in transport performance is paramount. Recurrent investments in the CBD produce a network design that does not promptly attends to subcentre flows (some of which with an already expressive scale), while failing to mitigate the overcrowding of radial lines. In that sense, the approach proposed by this paper would serve as a decision aid method, as it provides information about the degree of interconnection between the different parts of the territory. Based on such knowledge, the stakeholders are faced with two broad courses of action. On the one hand, heavily articulated subcentres, i.e. those with dense passenger flows in between, may be interconnected with priority, thus improving the level of service, because of the aforementioned reasons. On the other hand, one could identify urban areas which are poorly integrated to the territorial dynamic. Improving the latter connections could stimulate the socioeconomic development of such areas, while mitigating and correcting the imbalances of a markedly unequal urban history (cf. ABREU, 2013; VILLAÇA, 1998).
Finally, cyclical investments aimed at mitigating congestion in only one centre could be avoided by means of integrated planning (cf. QUANTA-LERNER, 2017), which should be accompanied by policies that promote sustainable urban development, such as social housing, and forward-thinking practises that incorporate long-term urban change processes to network design.
6. CONCLUDING REMARKS
This paper puts forward a method to identify the arrangement of a city’s structure based on the performance of its transit network, whereas traditional morphological approaches would investigate the distribution of densities throughout the territory. The observed trend in Rio de Janeiro, that is towards a concentrated decentralisation, is akin to that of world cities such as London (cf. ROTH et al., 2011).
The application of this method is conditioned to the features of the network in question. In the case of Rio’s metro system, it works in a rather straightforward manner, as its network may be represented by a spanning tree graph. Caution is advised when transferring it to other networks, specially the ones that allow for loops, because that makes for a cumbersome travel allocation. Roth et al. (2011) performed a similar study on London’s underground network and provide examples on how to address a more complex network and a more robust dataset.
This paper presents some limitations in its scope, as neither data from other transit subsystems, nor more recent metro data were provided for academic studies. Therefore, only a small portion of the intermodal transit network could be studied. Nevertheless, the kind of data required by the method may be easily gathered in closed transport systems, rail and BRT systems, assuming there is a reasonable cooperation with operators.
The results revealed substantial flows tied to both the main centre and other locations. These flows may be interpreted as either productive agglomerations or integration hubs, but as highlighted by Cats, Wang and Zhao (2015), telling them apart by flow analysis alone may be cumbersome. In any case, the relational impacts reveal the O-D matrices determine whether a given place has local or metropolitan reach. In the case study, the South Zone, especially Botafogo, presents such prominent flows that its ties to certain areas rival those of the CBD. The analysed network presents severe operational issues because of its diametral shape. In other words, the overcrowding of the critical area is made worse because it mixes demands bound to the CBD with demands that are bound towards secondary centres.
Smaller demands, bound towards subcentres, point to constant recurring investments aimed at reinforcing a radial transport infrastructure. Furthermore, there is an insistence to solve localised operational problems with piecemeal repairs, while ignoring its structural causes. Alternative approaches, such as routes tangential to the central area increase both the directness and the connectivity of the network, while attending neighbouring subcentres. This paper highlights the pertinence of the latter approaches. Further alternatives would be to strengthen potential peripheral subcentres for in the long run, by means of proactive and integrated land use planning. Thus, the controlled development of potential, emerging or non-existent subcentres, in coordination with transit provision, can strengthen areas that have grown isolated because of urban sprawl and that have long depended on the CBD.
Future research should aim at improving the proposed method. Above all, a more refined statistical analysis of the O-D matrices should be undertaken, which could include cluster analysis, for instance. Furthermore, incorporating morphological indicators to the analysis such as job density, as in Grunfelder, Nielsen and Groth (2015) may be in order. Other possibilities to enrich the method is to perform a study that more explicitly accounts for the diversity of the flow, as in as in Zhong et al. (2017), or that accounts it temporal variation throughout the day or the weekdays as in Marmolejo and Troncoso (2017).
6. ACKNOWLEDGEMENTS
This paper is the result of an online discussion on March 2014 – “RJ | MetrôRio” topic in SkyscraperCity forum (cf. posts 14565-14815). The debate concerned both the implications of Rio’s South Zone in a centre-oriented metro system, and the future of Line 1A in face of the implementation of Instalment 29. We thank the activists and enthusiasts from both the QUERO Metrô collective, and the Fórum Permanente de Mobilidade Urbana. Lastly, to the SkyscraperCity members who contributed to the discussion.
7. REFERENCIAS
ABREU, M. DE A. Evolução urbana do Rio de Janeiro. 4a ed. Rio de Janeiro: Prefeitura da Cidade do Rio de Janeiro, 2013.
ALIDADI, M.; DADASHPOOR, H. Beyond monocentricity: examining the spatial distribution of employment in Tehran metropolitan region, Iran. International Journal of Urban Sciences, v. 22, n. 1, p. 1–21, 2017.
ANAS, A.; ARNOTT, R.; SMALL, K. Urban Spatial Structure. Journal of Economic Literature, v. 36, n. 3, p. 1426–1464, 1998.
ASIKHIA, MO; NKEKI, NF Polycentric employment growth and the commuting behaviour in Benin Metropolitan Region, Nigeria. Journal of Geography and Geology, v. 5, n. 2, p. 1–17, mar. 2013.
BENCHIMOL, JL Pereira Passos: um Haussmann tropical. A renovação urbana da cidade do Rio de Janeiro no início do século XX. Rio de Janeiro: Biblioteca Carioca, 1990.
BOSERUP, E. Characteristic features of ancient urbanization. In: Population and Technological Change: a Study of Long-term Trends. 1. ed. Chicago: The University of Chicago Press, 1981a. p. 76–90.
BOSERUP, E. Population size and urbanization. In: Population and Technological Change: a Study of Long-term Trends. 1. ed. Chicago: The University of Chicago Press, 1981b. p. 63–75.
CATS, O.; WANG, Q.; ZHAO, Y. Identification and classification of public transport activity centres in Stockholm using passenger flows data. Journal of Transport Geography, v. 48, p. 10–22, 2015.
CERVERO, R. Road expansion, urban growth, and induced travel: a path analysis. Journal of the American Planning Association, v. 69, n. 2, p. 145–163, 2003.
CHAMPION, AG A changing demographic regime and evolving Polycentric Urban Regions: consequences for the size, composition and distribution of city populations. Urban Studies, v. 38, n. 4, p. 657–677, 2001.
CLARK, C. Transport: Maker and Breaker of Cities. The Town Planning Review, v. 28, n. 4, p. 237–250, 1958.
DERRIBLE, S.; KENNEDY, C. Characterizing metro networks: state, form, and structure. Transportation, v. 37, n. 2, p. 275–297, 2010.
DUARTE, H. DA SB A cidade do Rio de Janeiro: descentralização das atividades terciárias. Os centros funcionais. Revista Brasileira de Geografia, v. 36, n. 1, p. 53–98, 1974.
ESCAMILLA, JM; COS, CC; CÁRDENAS, JS Contesting Mexico City' s alleged polycentric condition through a centrality-mixed land-use composite index. Urban Studies, v. 53, n. 11, p. 2380–2396, 2016.
FERNÁNDEZ-MALDONADO, AM et al. Polycentric structures in Latin American Metropolitan Areas: identifying Employment Sub-centres. Regional Studies, v. 48, n. 12, p. 1954–1971, 2014.
Fundação Getúlio Vargas (FGV). Relatório Final dos Estudos de Demanda Linha 4 do Metrô do Rio de Janeiro. Rio de Janeiro: Secretaria de Estado de Transportes (SETRANS), 2012. Disponível em: <http://p-web01.mp.rj.gov.br/Arquivos/RAP/Estudo_Demanda.pdf>.
GRUNFELDER, J.; NIELSEN, TAS; GROTH, NB. Changes to urban form and commuting patterns: trends in two Danish city regions. Geografisk Tidsskrift-Danish Journal of Geography, v. 115, n. 2, p. 73-87, 2015.
GUEDES, E. O Metrô do Rio de Janeiro: interesses, valores e técnica em projetos estruturais de desenvolvimento urbano. Rio de Janeiro: Letra Capital; Observatório das Metrópoles, 2014.
Consórcio HALCROW-SINERGIA-SETEPLA. Relatório 3 do Plano Diretor de Transporte Urbano da Região Metropolitana do Rio de Janeiro (PDTU/RMRJ) – Atualização da Base de Dados – Anexo 1. Rio de Janeiro: Cia Estadual de Engenharia de Transportes e Logística (CENTRAL), 2012.
Consórcio HALCROW-SINERGIA-SETEPLA. Relatório 7 do Plano Diretor de Transporte Urbano da Região Metropolitana do Rio de Janeiro (PDTU/RMRJ) – Plano de Transportes. Rio de Janeiro: Cia Estadual de Engenharia de Transportes e Logística (CENTRAL), 2016.
Instituto Brasileiro de Geografia e Estatística (IBGE). Censo demográfico, 2010.
Instituto de Estudos do Trabalho e Sociedade (IETS). Centralidades da Região Metropolitana do Rio de Janeiro: Relatório Final. Rio de Janeiro: Câmara Metropolitana de Integração Governamental (CMIG), 2016.
Instituto Pereira Passos (IPP). Tabela 1267 - Passageiros transportados no Metrô, segundo as estações de entrada e linhas - Município do Rio de Janeiro - 1995-2016. Relatório. Rio de Janeiro: Instituto Pereira Passos, 2018.
KOSSMANN, HT; RIBEIRO, MAC Análise espacial das cadeias de lojas do comércio varejista no Rio de Janeiro. Revista Brasileira de Geografia, v. 46, n. 1, p. 197–218, 1984.
KRAFT, S.; MARADA, M. Delimitation of functional transport regions: understanding the transport flows patterns at the micro-regional level. Geografiska Annaler: Series B, Human Geography, v. 99, n. 1, p. 79–93, 2017.
LEVINSON, D. Density and dispersion: The co-development of land use and rail in London. Journal of Economic Geography, v. 8, no. 1, p. 55–77, 2008.
LIMTANAKOOL, N.; DIJST, M.; SCHWANEN, T. A Theoretical Framework and Methodology for Characterising National Urban Systems on the Basis of Flows of People: Empirical Evidence for France and Germany. Urban Studies, v. 44, n. 11, p. 2123–2145, 2007.
LIMTANAKOOL, N.; SCHWANEN, T.; DIJST, M. Developments in the dutch urban system on the basis of flows. Regional Studies, v. 43, n. 2, p. 179–196, 2009.
LIN, D.; ALLAN, A.; CUI, J. The impacts of urban spatial structure and socio-economic factors on patterns of commuting: a review. International Journal of Urban Sciences, v. 19, n. 2, p. 238–255, 2015.
MARMOLEJO, C.; TRONCOSO, J. El comportamiento espacio-temporal de la población como instrumento de análisis de la estructura urbana: el caso de la Barcelona metropolitana. Cuadernos Geográficos, v. 56, n. 2, p. 111–133, 2017.
NEWMAN, PWG; KENWORTHY, JR The land use-transport connection: an overview. Land Use Policy, v. 13, n. 1, p. 1–22, 1996.
ORRICO FILHO, RD. Redes de transporte público coletivo urbano: um roteiro metodológico para sua concepção. Projeto de Pesquisa MCT/CNPq Nº18/2009. Rio de Janeiro: Universidade Federal do Rio de Janeiro, 2013.
ORRICO FILHO, RD; AFFONSO, NS; SIMÕES, RBA; OLIVEIRA, MHS. Mobilidade urbana sustentável: questões do porvir. In: NUNES, T. (Ed.). Sustentabilidade urbana: impactos do desenvolvimento econômico e suas consequências sobre o processo de urbanização em países emergentes: textos para as discussões da Rio+20. 1. ed. Brasília: MMA e ONU-Habitat, 2015. p. 43–76.
PACIONE, M. Urban Geography: a global perspective. 3a ed. Nova York: Routledge, 2009.
Consórcio QUANTA-LERNER. Produto 11 do Plano Estratégico de Desenvolvimento Urbano Integrado da Região Metropolitana do Rio de Janeiro (PDUI/RMRJ). Rio de Janeiro: Câmara Metropolitana de Integração Governamental (CMIG), 2017.
RIO DE JANEIRO. Prefeitura da Cidade. Proposta de Metodologia para Hierarquização dos Centros e Subcentros da Cidade do Rio de Janeiro. Rio de Janeiro: SMU, 2014. Disponível em: <http://www.rio.rj.gov.br/dlstatic/10112/5333332/4139322/22DiagnosticoCentralidadeSMUCMP062014.pdf>. Acesso em: 13 out. 2017.
ROTH, C.; KANG, S. M.; BATTY, M.; BARTHÉLEMY, M. Structure of Urban Movements: Polycentric Activity and Entangled Hierarchical Flows. PLoS ONE, v. 6, n. 1, p. 2–9, 2011.
SHEN, Y.; KARIMI, K. Urban evolution as a spatio-functional interaction process: the case of central Shanghai. Journal of Urban Design, v. 23, n. 1, p. 1–29, 2017.
SINCLAIR-SMITH, K. Polycentric development in the Cape Town city-region: Empirical assessment and consideration of spatial policy implications. Development Southern Africa, v. 32, n. 2, p. 131–150, 2015.
SINCLAIR-SMITH, K.; TUROK, I. The changing spatial economy of cities: An exploratory analysis of Cape Town. Development Southern Africa, v. 29, n. 3, p. 391–417, 2012.
Consórcio SYSTRA-SETEPLA. Relatório Final do Projeto do Corredor BRT Expresso Metropolitano do Rio de Janeiro. Rio de Janeiro: Secretaria de Estado de Transportes (SETRANS), 2011.
TORTORIELLO, LFP; PEREIRA, WF Estudo de demanda do VLT do Rio de Janeiro. 19o Congresso Brasileiro de Transporte e Trânsito. Anais...Brasília: 2013
VILLAÇA, F. Espaço intraurbano no Brasil. 2a ed. São Paulo: Studio Nobel, 1998.
VUČIĆ, VR History and role of public transportation in urban development. In: Urban Transit Systems and Technology. 1a ed. Hoboken: John Wiley & Sons, Inc., 2007a. p. 1–44.
VUČIĆ, VR Transit line capacity. In: Urban Transit Systems and Technology. 1a ed. Hoboken, NJ, USA: John Wiley & Sons, Inc., 2007b. p. 149–201.
ZAMBON, I.; SERRA, P.; GRIOGORIADIS, E.; CARLUCCI, M.; SALVATI, L. Emerging urban centrality: An entropy-based indicator of polycentric development and economic growth. Land Use Policy, v. 68, p. 365–371, 2017.
ZEMP, S.; STAUFFACHER, M.; LANG, D. J.; SCHOLZ, R. W. Classifying railway stations for strategic transport and land use planning: Context matters! Journal of Transport Geography, v. 19, n. 4, p. 670–679, 2011.
ZHANG, P.; ZHOU, J.; ZHANG, T. Quantifying and visualizing jobs-housing balance with big data: A case study of Shanghai. Cities, v. 66, p. 10–22, 2017.
ZHONG, C.; SCHLÄPFER, M.; ARISONA, S. M; BATTY, M.; RATTI, C.; SCHMITT, G. Revealing centrality in the spatial structure of cities from human activity patterns. Urban Studies, v. 54, n. 2, p. 437–455, 2017.
![]() This
work is licensed under a Creative Commons Attribution 4.0 International
License.
This
work is licensed under a Creative Commons Attribution 4.0 International
License.