Revista Produção e Desenvolvimento, v.4, n.3, p.29-41, 2018
DOI: https://doi.org/10.32358/rpd.2018.v4.274
BUSINESS INTELLIGENCE IN EDUCATION: AN APPLICATION OF PENTAHO SOFTWARE
|
Munir de Sá Mussa1*; Saulo Chaves de Souza1; Eduardo Francisco da Silva Freire1, Renata Gomes Cordeiro1, Henrique Rego Monteiro da Hora1
1 Instituto Federal Fluminense, 28080-565, Campos dos Goytacazes-RJ, Brasil
|
|
Manuscript received 21/12/2017 and accepted 26/03/2018 |
ABSTRACT
Business Intelligence (BI) systems can be defined as tools to assist and extend decision making processes and make them more accurate and reliable, based on the knowledge generated by the company's data than intuitive values and personal experiences. Among the various software available, Pentaho is free software that provides good possibilities of exploring BI resources and with the possibility of personalization. This paper aims to present an application of Pentaho software demonstrating its use in the context of an educational institution. Through the creation of a multidimensional model and the insertion of academic data from a educational institution into a data warehouse, the Pentaho suite was configured to display data in a multidimensional form. It was identified that the unified exposure of these data presents itself as an interesting alternative to provide applied information, which allows specific analyzes by educational managers.
|
KEYWORDS: Business Intelligenc; Pentaho; Data Warehouse. |
BUSINESS INTELLIGENCE NA EDUCAÇÃO: UMA APLICAÇÃO DO SOFTWARE PENTAHO
RESUMO
Os sistemas de Business Intelligence (BI) podem ser definidos como ferramentas para auxiliar e ampliar os processos de tomada de decisões e torná-los mais precisos e confiáveis, baseado no conhecimento gerado pelos dados da empresa do que valores intuitivos e vivências pessoais. Dentre os diversos softwares disponíveis, o Pentaho é um software livre que fornece boas possibilidades de exploração dos recursos de BI e com possibilidade de personalização. Este trabalho visa apresentar uma aplicação do software Pentaho demostrando a sua utilização no contexto de uma instituição de ensino. Através da criação de um modelo multidimensional e da inserção de dados acadêmicos de uma instituição de ensino em um data warehouse, a suíte Pentaho foi configurada para apresentar os dados de forma multidimensional. Foi identificado que a exposição unificada desses dados apresenta-se como uma alternativa interessante para prover informações aplicadas, que permitem análises específicas por gestores educacionais.
|
PALAVRAS-CHAVE: Business Intelligence. Pentaho. Data Warehouse. |
1. INTRODUÇÃO
Information is, undoubtedly, the basis for the construction of knowledge. In the corporate environment, entrepreneurs are responsible for conducting business, and for this, they need the information of the organization, which will be essential in the decision-making process. Based on his / her professional experiences and the operational information of the organization, the administrator will make the decisions that will define the directions to be followed by the institution (CARDOSO E MACHADO, 2008).
At the same level of organizations are the educational institutions, which also need to make decisions that favor better outcomes and the adoption of more effective management practices. In order to carry out an effective decision-making process, appropriate and timely information must be made available that is relevant to the process. Thus, the use of intelligent information is fundamental for qualified decision-making, aiming at formulating strategies and reinforcing the capacity to compete in an environment of constant changes (CASARTELLI et al., 2010).
According to Peng, Tuan and Liu (2017) in any type of organization, including educational institutions, there is a system of decisions, with the purpose of choosing and deciding, among the possible alternatives, the most rational ones to solve the problems with which they face. He adds that each university determines its own evaluation model, often influenced by various environmental, internal and external factors, adapting to that in which their reality more fits. Thus, there are no recipes that point to a form of evaluation that is more efficient than the other.
Business Intelligence (BI) systems can be defined as tools to aid and amplify the results obtained in this decision-making process and make it more accurate and reliable based on the knowledge generated by the company's data than intuitive values based on personal experiences (NARENDRA, 2015). This process, also present in educational institutions, defines the educational paths that the institution must follow. Most of the time, in these institutions, the same problem of organizations exists, decisions are made based on vague data and not on the knowledge generated by them (PENG; TUAN; LIU, 2017).
The purpose of this article is to present an application of the Pentaho software, demonstrating its use in the context of an educational institution. Through the study carried out it is possible to verify how the software can be configured and prepared to meet the managers in the area of education.
2. BUSINESS INTELLIGENCE
In the competitive world of the labor market, more and more, it is necessary that organizations look for ways to reach a differential and, therefore, to stand out in this market. Business Intelligence is a solution increasingly explored primarily by large and medium-sized companies, due to their ability to unify data and provide managers with reliable and compelling information to aid decision making (LIMA AND BOSCARIOLI, 2012).
According to Peng, Tuan and Liu (2017), Business Intelligence has as its main objective to provide information in the right way and in the right time so that the company can make the best decisions in a faster and more reliable way. It is a set of tools and applications that enable decision makers to organize, analyze, distribute and thus act on the information relevant to the company's business.
According to Reginato and Nascimento (2007), "BI tools can provide a systemic view of the business and help in the uniform distribution of data among users, and their main objective is to transform large quantities into decision-making." According to the authors, the BI tools provides the exchange of data, visualization of information in various dimensions and analysis of key indicators of business performance. That is, turning the data into quality information.
2.1 Softwares Business Intelligence
Currently there are several software capable of managing information from a database so that it can be used in the decision making process in organizations. The most widespread are owned by large IT companies, others are independent and there are still free softwares (RUNTUWENE et al., 2018).
Among the most used are: Pentaho Business Analytics, free software, Business Intelligence Enterprise Edition, Oracle, BusinessObjects BI, SAP, Cognos, IBM and Business Intelligence Overview, Microsoft. The last four sets of systems are products of large companies and have several advantages and disadvantages when compared to suites classified as free software. Faced with the options, the best choice of the company depends on the approach you want to achieve, or what your main focus is on.
Ferreira et al. (2010) states that these big companies argue that the use of their software along with other product offerings, enables better responses and thus higher customer satisfaction as the expected results. On the other hand, besides leaving the organization dependent on them, the cost of acquiring the software is, for the most part, quite high, which ends up not satisfying the cost-benefit ratio. In this context, the use of free software is posed as a way to improve this relationship and obtain a satisfactory result.
Montaño et al. (2008) allows us to verify, through his research, the usefulness and importance of using a good tool that is able to provide relevant information for a study and thus identify failures in order to prioritize the critical points of the process. Runtuwene et al. (2018) states that making comparisons between Pentaho and Microsoft software, the former is more effective in the technology development solution that the system developer can find in the future as well as offering a less complicated interface.
Ferreira et al. (2010) reiterates that the choice of suitable software depends on the focus that one wishes to obtain. And it is worth mentioning that Pentaho corresponds to institutions that have financial restrictions and customization needs, both functional components and interface, need to use several operating systems and remote access to the tool. From the analysis of these items, it can be concluded that the profile described is better suited to the reality of an educational institution that may require customization of components to fit the educational reality and access through different operating systems facilitating the use of all involved in the process.
Business Intelligence software is comprised of a range of other tools that, together, enable your user to support and assist in making decisions. The entire BI management process consists of basically three steps, as described by Runtuwene et al. (2018): Data storage (Data Marts and Data Warehouse), OnLine Analytical Processing (OLAP), and Data Mining.
2.2 Suíte Pentaho
Pentaho Business Analytics is free software, and it has all of its open source code for developing projects that use Business Intelligence. According to Montaño et al. (2008) as options available is generation of reports on dimensional databases and presentation of data in the form of cube (pivoting). One of Pentaho's main differentials in relation to other BI software is the possibility of customization that it offers. The use of descriptor files in XML format allows change at runtime, making it easier to generate reports and more accurate information.
The suite is composed of five softwares that were produced with the objective of assisting in each specific stage of the process of creating a BI project. Each software can therefore be used individually, or with other tools. However, their use together provides a better performance, since they complement each other in their functionalities.
The five softwares are described by Purificação et al. (2011):
· Pentaho BI Platform: Contains the infrastructure responsible for integrating the BI solution. It provides essential services for building, deploying, executing and supporting reports, analyzing cubes, dashboards, etc. It also provides mechanisms for authentication and access control;
· Pentaho Data Integration (PDI): Also known as Kettle, this tool is responsible for the process of Extraction, Transformation and Load (ETL) or Extraction, Transformation and Load;
· Mondrian: It is an OLAP server that allows to analyze interactively large datasets stored in relational databases;
· Pentaho Reporting: It is a collection of open source projects, with a focus on creating, producing and publishing report content in a rich and sophisticated way.
· Weka: It is a comprehensive set of tools for machine learning and data mining. It can be used to help you better understand the business of the institution.
Still according to Purificação et al. (2011) the Pentaho Business Analytics suite is available in two versions: The Community Edition and Enterprise Edition. The first is maintained by a community of volunteers and has all of its open source. The second, the commercial version of the software, has a part of its code closed and Pentaho Corporation, headquartered in Orlando, Florida, with offices in San Francisco, California and across Europe, is the maintainer that provides technical support and extra features to customers.
3. MATERIALS AND METHODS
As a first step, a bibliographical research was carried out in order to identify and expand the knowledge essential for this work. Initially, the understanding of the steps of transforming data into information and information into knowledge at the different levels of an organization and an educational institution. The data transformed into information to be analyzed and the information, transformed into knowledge is the great value of the present and of great importance in the processes of an organization, especially in the making of decisions. Based on this, in order to manage this information and make it known, it is of fundamental importance to use software that facilitates managers in this process. In this context are included management information software and decision support software, which respectively gather data in information and provide the necessary support for the necessary decision-making, and in this context insert the Data Warehouse, making the information always available for managers to carry out the desired analyzes.
In the second stage was the mining and reverse engineering of the available academic database. From this operational database we extracted the information that came to compose the new database in the data warehouse standards. To perform the task of data mining, there was a need for an in-depth study of these standards for application in the case under analysis, as well as the structural constitution of the database used for the operationalization of enrollments, enturmings, journal entries with notes and frequencies of students and all other activities typical of the academic record sector. At this stage, in fact, they were carried out the processes of creation of the visions of the extracted data, as well as the business intelligence software settings.
4. RESULTS AND DISCUSSION
4.1 Characterization of the object of study
The case study presented in this study was carried out at the Federal Institute of Education, Science and Technology Fluminense, which is one of the 38 created in December 2008 by the Federal Government, from the Cefets, agrotechnical schools and linked to the universities. The expansion project of the Federal Network was started in 2005. Currently, the centennial IF Fluminense works in the three levels of vocational training, in initial and continuing education of workers, technical courses and higher courses in technology, high school, youth and adult education, Bachelor's, Post-Graduate and Master's degree courses.
At the Federal Fluminense Institute, the decision-making process goes through different hierarchical levels where the course coordinators, teaching directors, councils, pro-rectors of teaching and institutional evaluators are. These managers carry out analyzes and evaluations through the academic management software of the institution and through requests to the Academic Registry that returns them in the form of spreadsheets or other ways. This process is laborious and involves a lot of people who should perform other tasks instead of locating and providing information to meet managers' requests. The process is well distributed and involves several managers located at different strategic levels. Since pro-rectories, and coordination of each campus, gathering the information to the rectory and campus directors in order to carry out strategic decisions. In this process are still inserted the advice of the campuses that support and assist. Among them we can mention: forum of coordinators, forums of education, research and extension, among others.
The data used in this study are composed of data related to the students and teachers of various institute campuses, from which personal information was collected in order to present only values without identifying their owners. Since the objective of this work is to present the application of educational data in the Pentaho suite, the data used meet this objective.
4.2 Reverse engineering
As a starting point for carrying out the case study, a study of the database made available by the Institute was carried out. For this, a tool was used that would allow the realization of this reverse engineering and provide an overview of the existing data. The software used was SQL Manager for SQL Server 2008, which made it possible to view the database in an amplified way through a relationship diagram. The choice of the software was due to the option to provide this amplified view, because as the available database contained a large number of tables and relationships, the software helped to better understand the existing relationships.
The realization of this reverse engineering was of extreme importance to assimilate the information contained in the bank, to be able to locate the data and to understand the existing relationships between the tables. For this, in parallel with the analysis of the bank was used the Institutional Academic software in order to validate the information found in the database.
For the case study the tables were analyzed: courses, scores, enrollment, institutions and teacher. Each of these tables has several fields that are used in the institute software, but for the study were selected only the fields necessary for the creation of cubes used. Figure 1 shows the diagram mounted with the selection of some of these tables.
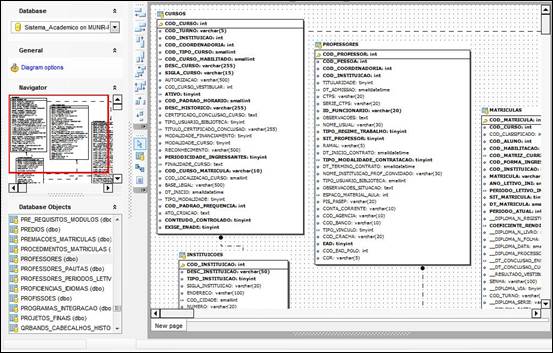
Figure 1 - Presentation of the SQL Manager for SQL Server 2008 software screen with database tables. Source: Own elaboration.
4.3 Cube Definition
After reverse engineering the operational database, the definition of the facts was made, dimensions and measures that would make up the cube would be developed for the use of multidimensional model.
For the definition of the cube it was necessary to answer a series of questions that according to Morales (2012) must be made before starting the creation of the multidimensional model. From this, the tables and relationships in the database were created. The database used was SQL Server, since the source database of the data provided by the Institute was also SQL Server.
The database and relationships were created based on the multidimensional star model, which is the most used for the creation of dimensional models and has as a characteristic the creation of the table of fact with the foreign keys of each primary key of the dimension tables, forming a diagram similar to a star. In the case study, two fact tables, Aluno, were created, containing the foreign keys: cod_aluno, cod_di_instituicao and cod_di_curso, in addition to the coeficiente_rendimento, which is the measure to be analyzed. Foreign keys are the primary keys of the respective dimension tables: di_aluno, di_instituicao and di_curso, as shown in Figure 2;
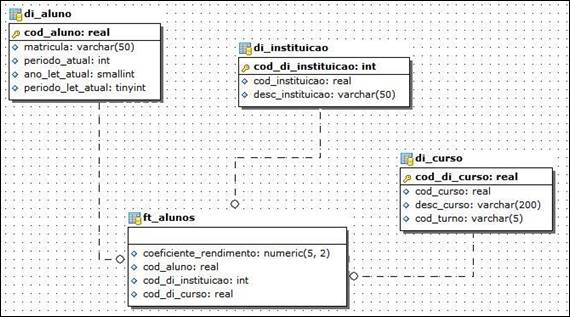
Figure 2 - Dimensions of the Aluno Fact. Source: Own elaboration
The fact table Professor was created containing the foreign keys: cod_professor, cod_pauta, cod_di_instituicao, besides the measure carga_hor_presencial, the measure to be analyzed in this fact. The foreign keys are the primary keys of the respective dimension tables: di_professor, di_pauta, di_instituicao, as can be seen in Figure 3.
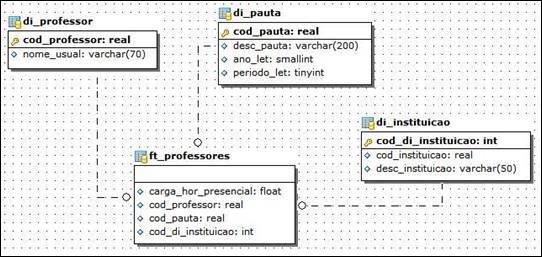
Figure 3 - Dimensions of the Professor Fact. Source: Own elaboration
4.4 Extract, Transform and Load (ETL)
The Extraction, Transformation and Load process was performed in one of the tools of the Pentaho suite, Data Integration, or Kettle. The tool provides the necessary support to perform all the tasks of this process. In the extraction stage, the data that would be used in the case study were selected from the database that was made available. Several fields have been extracted that can be used later, but only the previously defined fields will be used in the case study.
The Transformation step is responsible for making a selection of the data that is useful for the study, creating fields that do not exist, but the business requirements so require, and performing calculations for the creation of these new fields. In this step you can also modify the ways of viewing the fields or rename them. In the case study, some tables were transformed, such as di_curso and di_instituicao, because it was necessary te creation of a new field for the primary key, since the codes imported from the tables of the source database were duplicated due to the Data Warehouse concept that introduces fact table.
In the Load step, the values selected in the previous step are inserted into the desired table in the target database. For this, the connection to the target database has been created and selected a table where data will be inserted later. All the transformation performed in the di_curso table, presenting all the previously described items, is presented in Figure 4. This transformation is performed in all the previously defined dimensions and are very similar to this one presented.
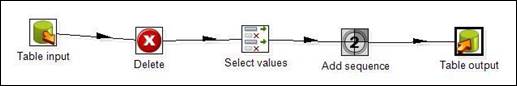
Figure 4 - Diagram of the transformation performed in the di_curso table. Source: Own elaboration.
In the fact table the settings are different from those in the dimension tables, since this table is responsible for joining the information and relating it. For the ft_professores and ft_alunos tables, the settings were similar. Figure 5 shows the entire transformation performed on the ft_professores table.
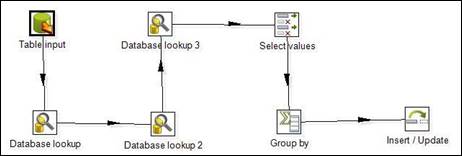
Figure 5 - Diagram of the transformation carried out in the table ft_professores. Source: Own elaboration.
4.5 Pentaho User Console
After performing the previous steps, with the multidimensional database already created and populated with all the desired information, the next step was to use the Pentaho User Console to provide the information to the user. Figure 6 shows the initial screen of the tool. This screen shows the options to create a report and creation of an analytical view.
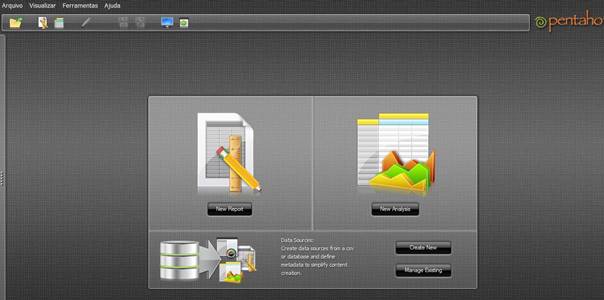
Figure 6 - Presentation screen of the Pentaho User Console. Source: Own elaboration.
To conclude the settings and make available for use, this step has been configured the connection with the database on the Pentaho Administration Console, so that the Pentaho BI Server could perform this connection. After this, two new data sources were created: one for the fact Professores and one for the fact Alunos. When creating the data sources, you need to insert an SQL consultation in order to define the fields and tables that you want to get. For this, Figure 7 presents the consultation performed for the fact Alunos.
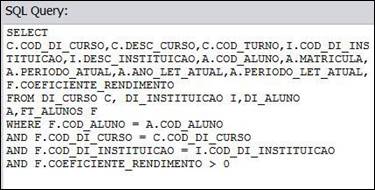
Figure 7. SQL consultation for the Alunos fact configuration. Source: Own elaboration.
After insertion of the query it is necessary to configure the cube, defining the dimensions, measures and hierarchies of each dimension. Figure 8 shows the configuration made for the Alunos fact table. It is important to note that the period, the school year and the school year were configured as dimensions, but this is only due to the way the data will be presented to the user, making it more propitious to analysis and decision making.
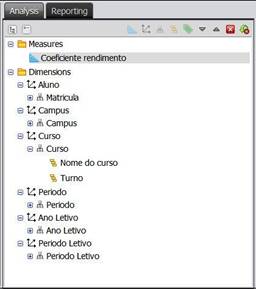
Figure 8: Fact Cube Configuration Alunos. Source: Own elaboration.
Once these settings have been made, the cube can already be viewed and manipulated. Figure 9 shows the cube with all the dimensions previously defined and the measure, the coefficient of efficiency. To do this, simply start a new analytical view and select the cube you want. It should be noted that the user does not perform the cube configurations, nor does it need to insert the SQL consultations, these creation and configuration tasks are left to the trained professional to perform them. This professional is responsible for performing all the steps described above and configuring the cubes and views according to the requests sent by the user. It is up to the user to simply request the information and views he wishes to obtain, and after the configuration made by the professional, he can have access to this information.
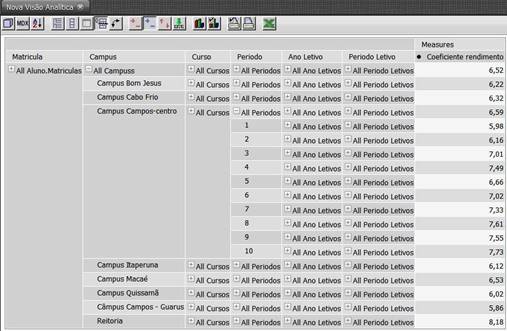
Figure 9: Cube Alunos extending the students and campus dimensions. Source: Own elaboration.
In this step, the user is able to extend the dimensions according to the analysis that he wants to perform. In addition, at runtime, it's possible to change the order of the columns in order to provide an analysis according to your need. Figure 10 shows the icons on the top left that the user must change to make changes to the columns. It is also possible to save the presented view with dimensions already extended in order to facilitate a new future consultation, providing greater agility and preventing execution errors.
The icons located at the top are also allowed to change display settings for the displayed cube by changing the columns for rows and rows for columns. This setting is interesting for analytical purposes and visualizations desired by the user. You can also print the screen you are analyzing and export it to Excel. Another option allowed is the display of graphs, changed according to the expansion of the views.
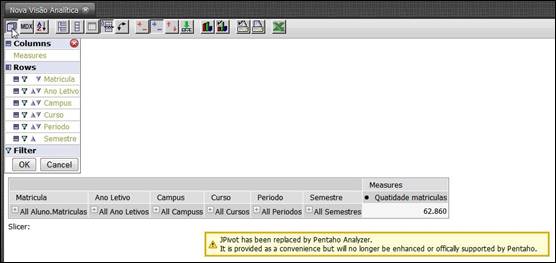
Figura 10. Cube Alunos screen, with configuration where user can change the order of the columns. Source: Own elaboration.
The exploitation of such information gives the manager the possibility to visualize the data, which are often scattered in various software of the institution, in an organized and precise manner. This exhibition in multidimensional form is interesting, since it facilitates the search for information of a specific value, as of a wide value. In the case of the number of registrations, shown in Figure 10, it is possible to verify the quantity of both the entire institution, and of a group in one year and semester specifically. The facility in the exploitation of this information is a decisive factor for the decision-making of the managers in the right time and moment, making an important differential for the institution.
Pentaho BI Server also offers simple and customized reports, choosing the file type of the exported report. The export options are: Excel spreadsheet, pdf file, csv file, and the option to just display on the screen, in HTML. Figure 11 shows a report exported in PDF, presented in the same software screen.
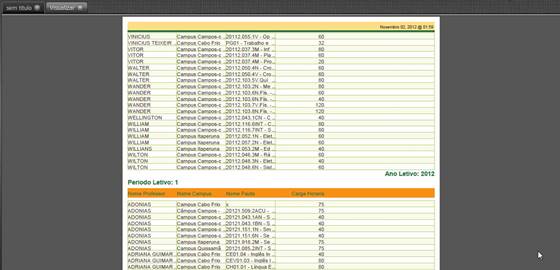
Figure 11: A pdf report screen where you can save it. Source: Own elaboration.
5. CONCLUSION
From the research carried out, it was possible to identify that the use of BI and the Pentaho suite can be broadly expanded at the Federal Fluminense Institute. Once the institution adopt the tool as a tool to aid decision-making can hold a large number of cubes settings and views so that they are available to managers and as the creation of new views is required, a scholar could attend these demands in a short time in order to generate more information to collaborate with strategic decisions.
The exploration of multidimensional information allows the manager the ability to view the data, which often are spread in various software of the institution, organized and accurate manner. This exhibition in interesting shows, since it facilitates the search for information of a specific value. The facility in the exploitation of this information is a decisive factor for the decision-making of the managers in the appropriate time and moment, making an important differential for the managers of the educational area. It was concluded that using the Pentaho software, the concept of Business Intelligence can be applied, generating information that can be used by educational managers of the Federal Fluminense Institute as a basis for making decisions relevant to the academic environment.
How important point, adds the use of the data presented in this study to provide information to managers and serve quantitative collection of students per course on the campus of the Institute. This provision is a concrete example of benefits that the institute can obtain through software use, with greater speed in the presented results.
Although the concept of Business Intelligence is native to a business need, its use is not restricted to this area. On the contrary, Business Intelligence can be used in any environment where informed decision-making is necessary, as long as relevant, organized and reliable technology and data are available. Therefore, it is possible to develop new work investigating the effectiveness of the use of BI tools as an aid to management in other non-business environments.
7. REFERENCES
CARDOSO, O. N. P.; MACHADO, R. T. M. Gestão do conhecimento usando data mining:estudo de caso na Universidade Federal de Lavras. Rev. da Administração Pública [online], v.42, n.3, pp. 495-528. 2008. Available on: http://www.scielo.br/scielo.php?script=sci_pdf&pid=S0034-76122008000300004&lng=en&nrm=iso&tlng=pt. Access in: 2017 dec 20.
CASARTELLI, A. O.; RODRIGUES, A. C. M.; BITTENCOURT H. R.; GARIBOTTI V. Inteligência estratégica em instituições de ensino superior. Rev. Perspectivas em Ciência da Informação [online], v.15, n.2. 2010. Available on: http://portaldeperiodicos.eci.ufmg.br/index.php/pci/article/view/952/740. Access in: 2017 dec 21.
FERREIRA, M.; PIAUHY, C.; CARVALHO, J.; SILVA, R.; VIEIRA, V. Um Estudo de Caso com Análise Comparativa entre Ferramentas de BI Livre e Proprietária. In: Escola Regional de Banco de Dados (ERBD), 2010, Joinville. Anais da Escola Regional de Banco de Dados 2010. Porto Alegre: SBC, 2010.
LIMA, V. M.; BOSCARIOLI, C. Uso de Ferramentas de Business Intelligence na Análise de Desempenho de uma Empresa de Agronegócios. In: Simpósio Brasileiro de Sistemas de Informação, VIII, 2012, São Paulo. ... São Paulo: SBSI, 2012. Available on: http://www.lbd.dcc.ufmg.br/colecoes/sbsi/2012/0042.pdf. Access in: 2017 dec 20.
MONTAÑO, R. A. N. R.; MIRANDA, M. R.; CASTILHO, M. A.; SILVA, L. F.; HEXSEL, R. A. Businness Intelligence nas Escolas Públicas do Estado do Paraná. In: Workshop de Software Livre, IX, 2008, Porto Alegre. ... Porto Alegre: Workshop de Software Livre, 2008. Available on: http://wsl.softwarelivre.org/2008/0012/. Access in: 2017 dec 20.
MORALES, A. B. T. Sistemas de Apoio a Decisão. Course of Sistemas de Informação and Ciências da Computação. 2012. UNISUL. Florianópolis, Santa Catarina. Available on: http://aran.ispeople.org/sad. Access in: 2017 dec 20.
NARENDRA, A. P. Big Data, Data Analyst, and Competence Improvement of Librarian. Record and Library Journal, v. 1, n. 2, p. 83–93, 2015.
PURIFICAÇÃO, M. C. S.; SANTOS, A. L. M. P.; BORGES, F. C.; SILVA, H. A. C.; PEREIRA, M. J. Uma Proposta de Aplicação de Business Intelligence para o Censo das IES. In: Workshop de Software Livre, XII, 2011, Porto Alegre. ... Porto Alegre: Workshop de Software Livre, 2011. Available on: http://wsl.softwarelivre.org/2011/0009/. Access in: 2017 dec 21.
PENG, M. Y.-P.; TUAN, S.-H.; LIU, F.-C. Establishment of business intelligence and big data analysis for higher education. . In: ACM INTERNATIONAL CONFERENCE PROCEEDING SERIES. 2017
REGINATO, L.; NASCIMENTO, A. M. Um estudo de caso envolvendo Business Intelligence como instrumento de apoio à controladoria. Rev. contab. finanç., vol.18, no.spe, p.69-83. 2007.
RUNTUWENE, J. P. A. et al. A Comparative Analysis of Extract, Transformation and Loading (ETL) Process. IOP Conference Series: Materials Science and Engineering, v. 306, n. 1, p. 012066, 2018.
![]() This
work is licensed under a Creative Commons Attribution 4.0 International
License.
This
work is licensed under a Creative Commons Attribution 4.0 International
License.