1. INTRODUCTION
For Gehl (2014) a safe city is created when more people move through it and remain in public spaces. “A walkable city, by definition, must have a reasonably cohesive structure that allows for short walking distances, attractive public spaces and a variety of urban functions.” In this context, squares gain prominence in view of their social, cultural, urbanistic and environmental functions, capable of favoring urban vitality and sociocultural enrichment.
Considering the potential of squares, the relevance of studies that assess the socio-environmental quality of these spaces is evident (Fayyaz et al., 2022; Holy-Hasted & Burchell, 2022; Tedjari & Abbaoui, 2023; Quagliarini & Bernardini, 2023), as well as evaluation methods that seek to identify strengths and weaknesses that compromise the user-environment relationship and consequently keep people away from staying and circulating in these spaces. In order to carry out evaluations and classifications of public spaces, focusing on squares, an analytical-classificatory tool named “QualificaURB” was developed within the scope of the research group “Urban Landscape and Inclusion”, which, in addition to contributing to the understanding of the squares, aims to identify aspects that can be improved for targeted urban interventions and optimization of public investments.
This article also presents a comparative analysis between the best evaluated square and the one with the worst evaluation, having as a spatial cut the squares of Regional Administrative I - Great Center, municipality of Vila Velha - ES. The study aims to contribute to the improvement of the quality of open spaces for public use in the municipality of Vila Velha, through the characteristics of each square, verifying which aspects (social, environmental and/or urban) contribute or harm the quality of these spaces. The activities to be developed are defined in three methodological steps, being: contextualization of the theme; mapping and analysis of the socio-spatial distribution of squares and application of the socio-environmental assessment tool and analysis of indicators.
2. LITERATURE REVIEW
The urbanization process has reduced public open spaces and urban green areas, harming the quality of life of the population, however, researches evidence that living close to the urban squares can have positive impacts on quality of life, in particular, the square that have infrastructures that enhance the practice of physical activities (Beraldo et al, 2022).The residents quality of life is positively related to the quality of the public open space (Jansen et al., 2017). According to Robba & Macedo (2002), squares play an important role in the constitution of Brazilian cities, especially in densely populated areas, where the local microclimate is altered due to man's interventions in the environment. With the installation of industries, the densification of buildings, the opening of non-permeable roads and the reduction of green areas in public spaces, cities began to face several climatic problems, which even led to greater energy consumption in buildings.
The squares, in addition to social functions, also have ecological and aesthetic functions, contributing to thermal comfort and to the urban landscape, as stated by Hannes (2016). Regarding the environmental and ecological functions, these are related to the presence of green and permeable areas, which contribute to thermal comfort, to the reduction of air pollution and to soil drainage. The aesthetic functions refer to the construction of the landscape, reflecting the image of the space, with a pleasant, clean look and the availability of places to sit, elements that are considered key and fundamental to the quality and vitality of public spaces (Hemman & Santiago, 2016; Martins & Santos, 2023). A recent study conducted in China shows that soundscapes directly effect on relaxation, communication, spatiality and dynamics in public open areas. “Relaxation was greater when the natural sound was perceived dominantly, while it was lower when mechanical sounds or anthropogenic sounds were perceived dominantly” (Zhang et al., 2018, p.73). This factor makes clear the importance of evaluating too the sound quality of open spaces, capable of contributing to the well-being of the population.
Regarding public safety, Gehl (2014) states that it is people who make life in the city safer and more inviting, both in terms of experienced and perceived safety. For the author, feeling safe is “crucial for people to embrace the urban space”. Jacobs (2000) emphasizes that one of the main requirements for urban security is the “eyes of the street”, an expression that highlights the role of natural surveillance based on the presence of people on the streets, but also on buildings that allow, through their facades, visual contact with the outside. In this sense, a safe public space must have adequate infrastructure for the use of the population, with sufficient equipment and public lighting, diversity of uses, but also visual permeability, with active ground floors, as well as safe sidewalks and crossings for traffic.
However, in Brazil, planning ideologies and the urbanization process have promoted the development of infrastructures that emphasize the use of cars, neglecting pedestrians and the function of public space as a social meeting place (Gehl, 2014). Leite (2011) states that the social vision in which public spaces should promote socialization and people's encounter was not able to change the deficient physical organization and the disregard for open public spaces. Most Brazilian municipalities have open public spaces without connection to each other, not accessible from the point of view of urban mobility and lacking furniture and equipment that satisfactorily serve the population. This is impairing the access and use, especially by people with disabilities and/or with special needs, resulting in spaces that are often inhospitable and with little social diversity, which tend to be empty and neglected.
An accessible space should allow different audiences to reach it and move freely, ensuring greater use and experience. Accessible spaces that are connected to their surroundings have a higher turnover of people and, ideally, have a strong presence of public transport (ITDP Brasil, 2018). This factor even influences the feeling of public safety, since it enhances the “eyes on the street”, as defended by Jacobs (2000). In this way, public open spaces, especially squares, considered spaces for social, recreational and sports practices, have a prominent role in cities, as in addition to contributing to urban quality, they favor vitality, socio-cultural enrichment, exercise of citizenship and the constitution of the public sphere (MACEDO et al, 2018).
It is noteworthy that the “QualificaURB” tool has squares as its main object of analysis, aiming to overcome the lack of evaluation methodologies for public spaces and to encourage discussion about the importance of preserving the city's open spaces. The methods and results of this research will be presented below.
3. MATERIAL AND METHODS
This is an applied, exploratory and descriptive research, with a quantitative and qualitative approach, with an analysis of the squares of the Regional Grande Centro, in the municipality of Vila Velha - ES. The activities to be developed are listed and presented below:
3.1 Contextualization of the Theme
Stage intended for theoretical research and bibliographical and documental review to support the research and guide the analyses.
3.2 Mapping And Analysis of Square Distribution
The squares in the Great Center were identified and mapped using the Geographic Information System (GIS) - the QGis geoprocessing software, which allowed the generation of a digital cartographic base for the insertion of attributes for tabulation and generation of georeferenced data. In the identification and mapping process, satellite images from Google Earth and Google Maps programs were used, based on the classification of the Municipal Master Plan (VILA VELHA, 2018), which considers squares as Special Zones of Public Interest (ZEIPs). Local visits were also necessary to verify which of the ZEIPs have square infrastructure and an area greater than 450 m², as defined by Buccheri Filho and Nucci (2006).
After mapping the squares, an area of influence corresponding to a radius of 400 meters from each square was defined. Thus, it was possible to verify the scope of the square and the number of residents assisted by them within a radius of 400 m. The definition of the radius of 400 meters is based on the classifications by Berker et al. (2006).
3.3 Application of the social and environmental analysis tool
The "QualificaURB" tool was developed based on the Walkability Index - iCam (Brasil ITDP, 2019), through adaptations to the public space of the square, added to the concepts that Whyte (2009) presents in the Public Space Guide (Heemann & Santiago, 2015) and a vast literature review on the subject.
In the evaluation tool, the analysis parameters are organized into four categories: "Protection and Security", "Comfort and Image", "Access and Connections" and "Sociability, Uses and Activities", subdivided into attributes and indicators, to ensure applicability and subsequent comparison of results. The categories are subdivided into 11 attributes, which in turn are composed of 24 indicators. The first category, Protection and Security, verifies aspects of morphology and urban design that influence the safety of the square, as well as road infrastructure elements that contribute to pedestrian safety in relation to motor vehicle traffic. Environmental aspects are grouped in the “Comfort and Image” category, which verifies the situation of the square's environment and its relationship with comfort and the urban landscape.
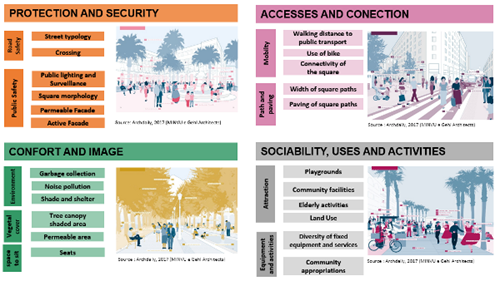
Figure 1: Illustration of categories, attributes and indicators of the “QualificaURB” tool
The “Accesses and Connections” category, in turn, discusses how accessible the squares are, considering the width and paving of the paths, as well as the possibilities of accessing them, either by public transport or bicycle. Finally, “Sociability, Uses and Activities” observes the appropriations, equipment and activities that attract, motivates, and give life to public spaces, directly influencing the conditions of appropriation and experience in the squares. The Figure 1 shows the categories, their attributes and indicators.
For each indicator there are analysis parameters, with specific criteria, which allow assigning a unit score according to the performance of the analyzed indicator (Conde et al., 2019). This score varies in a range from 0 (insufficient) to 3 (excellent), as shown in Table 1, thus allowing a classification of the indicators, but also of each attribute, category and place.
Table 1: Classification and assigned score
|
0 até 0,75 |
0,76 até 1,5 |
1,51 até 2,25 |
2,26 até 3,0 |
|
Insufficient |
Regular |
Good |
Excellent |
The collected information is entered into an online form, called CognitoForms platform, where the data is organized, stored and automatically evaluated, generating the final score of the indicators, attributes and categories.
4. RESULTS
The municipality of Vila Velha, according to the IBGE population estimate (2020), has 501,325 inhabitants and occupies an area of 209,965 km² (IBGE, 2010). The city is divided into five administrative regions, named: Regional 01 (Grande Centro), Regional 02 (Grande Ibes), Regional 03 (Grande Aribiri), Regional 04 (Grande Cobilândia) and Regional 05 (Grande Jucu).
The present article has as a spatial analysis the Regional 1 – Grande Centro (shown in Figure 2 in pink). It stands out for being a mostly coastal region, with tourist potential and growing social inequality between its neighborhoods.
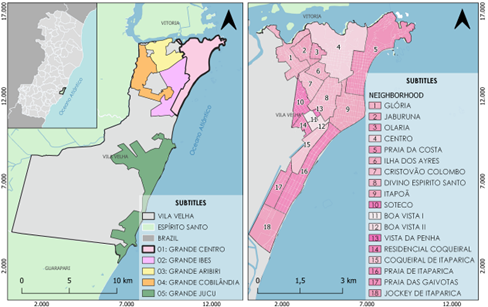
Figure 2: Map identifying Regional 1 and its respective neighborhoods
The Figure 3 identifies the physical and environmental aspects of the Region under study. The territory is flat for the most part, with some higher regions to the north. These regions are defined by the Master Plan (VILA VELHA, 2018) as Special Areas of Environmental Interest (ZEIAs) and are configured as important tourist attractions: Morro do Moreno and Convento da Penha, the latter one being of the oldest religious sanctuaries in Brazil. The region is cut by canals, which suffer from urban densification and are polluted. The inadequate treatment of these watercourses resulted in several floodable areas, highlighted on the map (Figure 3) as blue spots, representing a context of socio-environmental vulnerability for the Region and the entire municipality.
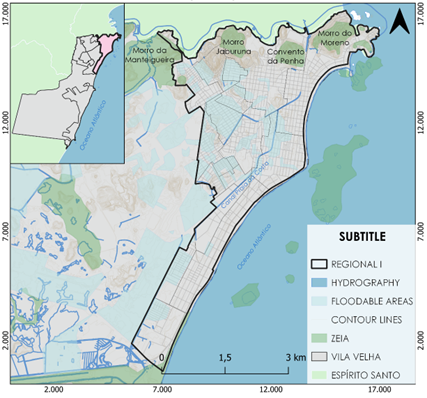
Figure 3: Physical-environmental map of Regional 1 – Grande Centro
The Municipal Master Plan (VILA VELHA, 2018) indicates the presence of twenty-three Special Public Interest Zones (ZEIPs) in the Greater Center. After visits to the Regional, it was found that 19 (nineteen) have square infrastructure. It is observed in figure 4 the spatial distribution of the squares and their respective radius of coverage, with emphasis on the best evaluated square of the Regional (outline in green) and the worst evaluation (outline in red), representing the squares Dom Cavatti and Jockey, respectively. Some neighborhoods are not contemplated with open public spaces, such as Soteco, Jaburuna, Olaria, among others. It is estimated that around 45% of the Regional population is served by squares.
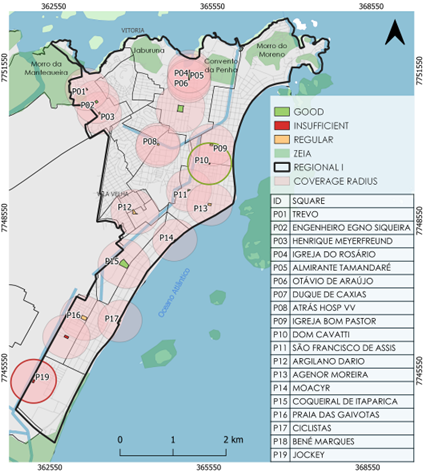
Figure 4: Identification of the squares of Regional I – Grande Centro
All nineteen Regional squares went through the evaluation process based on the application of the “QualificaURB” tool, generating a final average for the Regional of 1.43 points, considered “regular”. It is worth mentioning that none of the squares achieved the maximum score in their final score (Table 2) and more than 50% of them received a “regular” rating, which means an average performance in most of the evaluation criteria. Among the analyzed categories, “Sociability, uses and activities” received the lowest score, with an average of 1.28 points. This score denounces the lack of attractions in the squares of the Greater Center, especially for children and the elderly, with a lack of quality spaces to play and activities that include the “best age”. Despite the lack of public equipment and fixed services in the squares, community appropriations were observed, which favors the use and vitality of open spaces, as well as contributes to the feeling of belonging to the space and the surveillance of the square.
On the other hand, the category “Accesses and connections” reached the best performance, classified as “Good”, being the only category that presented classifications of the type “excellent” among the analyzed cities. The indicator that most positively contributed to this evaluation was the “walking distance to public transport”, showing that the Regional squares are, in general, easily accessible and well connected with the road network and with bus stops in their surroundings. Still in this category, the accessibility of the squares stands out, with paving and width of the pavements classified as “Good”.
Table 2: Classification of squares and general averages
|
SQUARE |
Protection and security |
Comfort and image |
Accesses and connections |
Sociability, uses and activities |
Final score |
|
P.1 Trevo |
2,13 |
1,00 |
2,08 |
0,50 |
1,43 |
|
P.2 Eng. Egno Siqueira |
1,38 |
0,92 |
2,67 |
1,13 |
1,52 |
|
P.3 Henrique Meyerfreund |
1,75 |
1,25 |
1,58 |
1,38 |
1,49 |
|
P.4 Igreja do Rosário |
2,00 |
2,25 |
1,67 |
0,75 |
1,67 |
|
P.5 Almirante Tamandaré |
2,00 |
1,17 |
1,67 |
0,50 |
1,33 |
|
P.6 Otávio de Araujo |
2,13 |
2,25 |
1,67 |
0,88 |
1,73 |
|
P.7 Duque de Caxias |
2,13 |
1,75 |
2,25 |
2,13 |
2,06 |
|
P.8 Hospital Vila Velha |
1,00 |
0,83 |
1,08 |
0,25 |
0,79 |
|
P.9 Bom Pastor |
1,13 |
1,25 |
2,25 |
1,13 |
1,44 |
|
P.10 Dom Cavati |
1,88 |
1,83 |
2,83 |
1,78 |
2,08 |
|
P.11 São Francisco de Assis |
1,88 |
1,67 |
1,58 |
1,25 |
1,59 |
|
P.12 Argilano Dario |
0,38 |
1,00 |
1,33 |
1,44 |
1,04 |
|
P.13 Agenor Moreira |
0,88 |
0,75 |
0,92 |
2,00 |
1,14 |
|
P.14 Moacyr Loureiro |
1,63 |
1,50 |
1,42 |
0,38 |
1,23 |
|
P.15 Coqueiral de Itaparica |
1,63 |
1,17 |
1,67 |
2,25 |
1,68 |
|
P.16 Praia das Gaivotas |
1,25 |
1,08 |
1,08 |
2,13 |
1,39 |
|
P.17 Ciclistas |
1,63 |
1,42 |
1,42 |
2,22 |
1,67 |
|
P.18 Bené Marques |
0,63 |
1,42 |
1,83 |
2,13 |
1,50 |
|
P.19 Jockey |
0,25 |
1,17 |
0,00 |
0,00 |
0,35 |
|
AVERAGE |
1,45 |
1,35 |
1,63 |
1,28 |
1,43 |
Note: The colors used refer to the classifications indicated in Table 1. Source: the authors.
Graph 1 lists the scores obtained in each category by the cities analyzed, in addition to the final average of each city. The only square that was classified as “insufficient” was Praça Jockey, located in the neighborhood of the same name. The square in question received a score of zero in two categories: “Accesses and Connections” and “Sociability, uses and activities”. The best evaluated square was Dom Cavatti, located in the Itapuã neighborhood, but still does not reach the “excellent” classification.
Graph 1: Notes on the squares of Regional I – Grande Centro
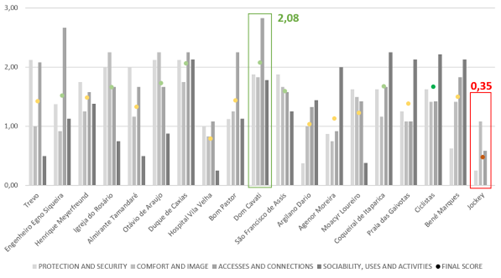
Note: the colors used to represent the average refer to the classifications indicated in Table 1. Source: the authors.
To better understand the results of the evaluation, Dom Cavatti and Jockey squares were selected, with the best and worst classification, respectively. The first was classified as “Good”, while the second was classified as “insufficient” (Figure 5). The best evaluated category in Dom Cavatti Square was “Accesses and connections”, with a score of 2.83, considered “Excellent”. For Jockey Square, the category “Comfort and Image”, despite being considered “regular”, had the best score. Also, in Jockey Square, the evaluation of the categories “Accesses and Connections” and “Sociability, Uses and Activities” received a zero score.
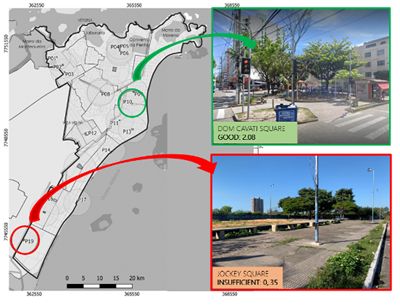
Figure 5: Location and scoring of Dom Cavatti and Jockey squares
Regarding the “Protection and Security” category, the Jockey Square received a score of 0.25, considered “insufficient”, and this factor compromises the road safety and public safety in this square. Dom Cavatti square (table 3), on the other hand, received a score considered “Good” in the “Protection and Security” category, requiring attention only for public lighting and diversified surroundings.
Despite the street typology surrounding the Jockey Square with segregated sidewalks and speeds of up to 60 km/h, there are no signposted pedestrian crossings on the perimeter of the square, nor strategies to reduce speed and/or protect pedestrians. The square still has inadequate public lighting and the absence of video surveillance and/or police patrols, factors that are directly related to urban security and natural surveillance, advocated by Jacobs (2000) and Gehl (2014), as they inhibit criminal actions.
Table 3: selected squares with the best and worst classification
|
JOCKEY (WORST FINAL SCORE) |
DOM CAVATI (BEST FINAL SCORE) |
|
|||||
|
AREA |
2028,84 m² |
AREA |
488,84 m² |
|
|||
|
PERIMETER |
192,25 m |
PERIMETER |
86,32 m |
|
|||
|
CATEGORY |
FINAL SCORE |
CATEGORY |
FINAL SCORE |
|
|||
|
PROTECTION AND SECURITY |
0,25 |
0,48 |
|
PROTECTION AND SECURITY |
1,88 |
2,08 |
|
|
CONFORT AND IMAGE |
1,08 |
COMFORT AND IMAGE |
1,83 |
||||
|
ACCESSES AND CONNECTIONS |
0,58 |
ACCESSES AND CONNECTIONS |
2,83 |
||||
|
SOCIABILITY, USES AND ACTIVITIES |
0,00 |
SOCIABILITY, USES AND ACTIVITIES |
1,78 |
||||
In the “Square morphology” indicator, elements that obstruct the complete view inside the square were evaluated, since high walls and constructions can create “blind” zones in the square and impair security in the place. Dom Cavatti Square received a “Good” rating for this indicator, however, Jockey Square received a zero score, as it has walls and building elements without access to the square in more than half of its perimeter, as can be seen in Figure 6. Facades around the squares also contribute to the natural security of the place, as they ensure “eyes on the street” (Gehl, 2014). Although the indicator “physically permeable facades” received the highest score in Dom Cavatti Square, the indicator “visually active facades” was classified as “regular”, showing that the surroundings of the square are not very diversified, with a predominance of residential buildings. Jockey Square received a zero score for both indicators, as it is located in a region with many empty lots and idle areas, jeopardizing local experience and safety, as can be seen in Figures 6 and 7.
In the “Comfort and Image” category, the Jockey square received a score of 1.17, which despite being considered “regular”, presents weaknesses mainly in terms of aesthetic quality – with signs of abandonment, lack of maintenance, presence of garbage and debris – and lack of shaded areas. The square shows signs of vandalism, in addition to having few trees and/or shading elements, making it difficult to use it in periods of greater sunlight. Dom Cavatti Square, however, presents a “Good” performance in the “Comfort and Image” category, with a well-maintained environment, aesthetic quality, landscaping in good condition. Dom Cavatti Square also has spaces shaded by trees and permeable areas.
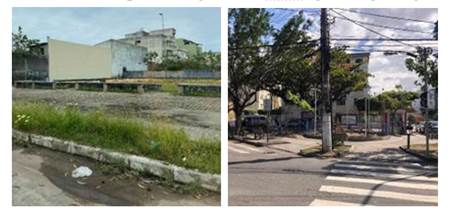
Figure 6: Jockey and Dom Cavatti squares, respectively.
Regarding the category “Accesses and connections”, this was the best evaluated in Dom Cavatti Square, classified as “excellent” (score 2.83), indicating that the square presents connectivity with the road network, with possibilities of arrival/access to it, either by public transport or bicycle, with a bus stop in its perimeter, paracycle, bike-sharing station and cycle route within the range, in addition to ensuring accessibility with well-paved and sized routes. On the other hand, Jockey Square received a zero score in all the attributes of the category “Accesses and connections”, revealing the urgency of interventions in this field. It is worth highlighting the need for better connectivity between Jockey Square and its surroundings, given that the square is located in a superblock that is still unoccupied, walled on three of its four sides, on a dead-end street, facing a polluted channel with no connection to the region, characterized by subnormal clusters that occupy the banks of the channel.
The scenario is repeated in the category “Sociability, uses and activities”. Jockey Square received a score of zero in all indicators, signaling the lack of equipment and activities that attract audiences of all ages and contribute to permanence and experience in the public space of the square. Jockey Square does not have spaces to play, community equipment, activities that include the elderly, little diversified surroundings, no community equipment nearby, no fixed equipment and services, nor community appropriations. Dom Cavatti Square has a playground, popular gym, games table, newsstand, taxi rank, elements that encourage the use and appropriation of public space, in addition to the existence of a community facility (elementary school) in the vicinity (Figure 7).
In Figure 7, the map of the analyzed squares and their surroundings can be seen - considering the radius of 400 meters - with emphasis on the blocks, lots and the road network of the region where they are located, also showing the urban equipment and other existing elements in the vicinity of the squares that helps in its understanding.
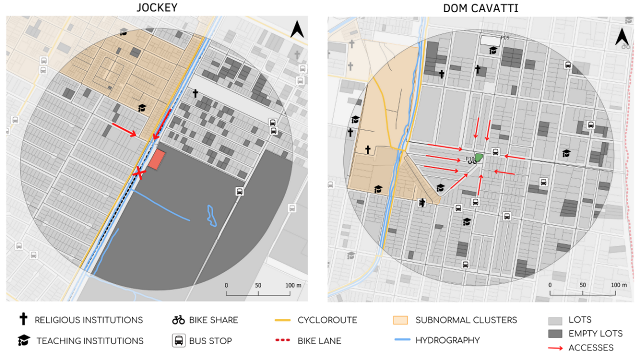
Figure 7: Map of public facilities and road system of Dom Cavatti and Jockey squares, respectively
The surroundings of Dom Cavatti Square have several schools, religious institutions and small businesses, in addition to several bus stops and a bicycle sharing system. Jockey Square, in turn, is surrounded by empty areas and land that do not fulfill the social function of the property, resulting in a little-used, insecure and inaccessible square.
It is worth mentioning the absence of urban equipment in its surroundings, in addition to the lack of possibilities to reach the square, which hinder its access and, consequently, the use and appropriation of the space.
5. CONCLUSION
Public open spaces, especially squares, in addition to being places for social interaction, are fundamental to the well-being of the city. When qualified, accessible, connected, safe, comfortable and with diversities of use, they allow urban opportunities and improve the user-environment relationship, directly influencing the use and appropriation of the square. However, problems related to the maintenance and management of these spaces still prevail in most Brazilian cities, as seen in the squares of the Grande Centro.
It is worth mentioning that regular maintenance guarantees the preservation of these already consolidated spaces, to assure longevity and vitality. There is a certain disregard for open public spaces in Regional I, neglecting the social function of squares. When comparing the best and worst evaluations, the most critical points are related to the square's accessibility, aesthetic quality and the supply of equipment and various activities, which could attract people and redefine the square's space. The issue of visual permeability as an element that helps public safety was also decisive in assigning the grades to the squares, since the Jockey Square is closed by walls with no access in about 75% of its perimeter, bringing a feeling of insecurity to users.
By creating inclusive and comfortable meeting places, the sphere of public life is enriched, and the local community takes ownership of the public space, ensuring safety and benefiting urban life. The results allow a more accurate assessment of each square, since by showing indicators with the worst grades, the main weaknesses of the square are suggested, thus allowing targeted intervention proposals, optimizing resources and investments. The evaluations aim to contribute to the construction of a diagnosis of the quality of open spaces for public use for social practices in the municipality of Vila Velha, as well as to verify which aspects (social, environmental and urban) contribute to the quality of these spaces.
6. REFERENCES
Berke, Philip, Godschalk, David R., Kaiser, Edward J., Rodriguez, D. (2006). Urban land use planning. 5th edition. Urbana: University of Illinois Press.
Buccheri Filho, A. T., & Nucci, J. C. (2006). Espaços livres, áreas verdes e cobertura vegetal no bairro Alto da XV, Curitiba/PR. Revista do departamento de Geografia, 18, 48-59. https://doi.org/10.7154/RDG.2006.0018.0005
Conde, K.; Alvarez, C.; Bragança, L. (2019) Proposta de critérios e indicadores de avaliação de sustentabilidade urbana para países latino-americanos. In: EuroELECS 2019. III Encontro Latinoamericano Y Europeo sobre Edificaciones y Comunidades Sostenibles. Argentina, Anais... Santa Fé, Argentina, Maio 22-25, p.1412-1424.
Degreas, H. N., & Ramos, P. G. (2015). Espaços livres públicos: formas urbanas para uma vida pública. Quapá, USP.
Beraldo, E. B., Tourinho, A. C. C., Barbosa, S. A., Castro, S. R., & Alberto, K. C. (2022). Public open spaces and quality of life: evidence from the WHOQOL-BREF protocol. Oculum Ensaios, 19, 1-20. https://doi.org/10.24220/2318-0919v19e2022a5288.
Fayyaz, M., González-González, E., & Nogués, S. (2022). Autonomous Mobility: A Potential Opportunity to Reclaim Public Spaces for People. Sustainability, 14(3), 1568. https://doi.org/10.3390/su14031568
Gehl, Jan. (2014). Cidades para pessoas. 2. ed. São Paulo: Perspectiva.
Hannes, E. (2016). Espaços abertos/espaços livres: um estudo de tipologias. Paisagem e ambiente, (37), 121-144. https://doi.org/10.11606/issn.2359-5361.v0i37p121-144
Heemann, Jenifer; Santiago, P. Caiuby. (2015). Guia do espaço público para inspirar e transformar. Mountain View (CA), USA.
Holy-Hasted, W., & Burchell, B. (2022). Does public space have to be green to improve well-being? An analysis of public space across Greater London and its association to subjective well-being. Cities, 125, 103569. https://doi.org/10.1016/j.cities.2022.103569
IBGE. Instituto Brasileiro de Geografia e Estatística. (2010). Censo Demográfico 2010. Características da população e dos domicílios: resultados do universo. Rio de Janeiro: IBGE.
IBGE. Instituto Brasileiro de Geografia e Estatística. (2020). IBGE Cidades-População estimada. Rio de Janeiro: IBGE. Disponível em: https://cidades.ibge.gov.br/brasil/es/vilavelha/panorama. Acesso em 03 abr. 2021.
ITDP Brasil. (2019). Índice de Caminhabilidade Ferramenta, Versão 2.0. Rio de Janeiro.
Jansen, F. M., Ettema, D. F., Kamphuis, C. B., Pierik, F. H., & Dijst, M. J. (2017). How do type and size of natural environments relate to physical activity behavior?. Health & place, 46, 73-81. https://doi.org/10.1016/j.healthplace.2017.05.005
Jacobs, Jane. (2000). Morte e vida de grandes cidades. São Paulo: Martins Fontes.
Leite, M. A. F. P. (2011). Um sistema de espaços livres para São Paulo. Estudos Avançados, 25(71), 159. https://doi.org/10.1590/S0103-40142011000100011
Macedo et al. (2018). Os Sistemas de Espaços Livres e a constituição da esfera pública contemporânea no Brasil. São Paulo: Universidade de São Paulo.
Martins, B. F. G., & Santos, L. M. (2023). Playing in urban green spaces according to two generations. Revista Produção e Desenvolvimento, 9(1), e623. https://doi.org/10.32358/rpd.2023.v9.623
Mazzei, K., Colesanti, M. T. M., & Santos, D. G. (2007). Áreas verdes urbanas, espaços livres para o lazer. Sociedade & Natureza, 19(1), 33-43. https://doi.org/10.14393/SN-v19-2007-9350
Quagliarini, E., Bernardini, G., Romano, G., & D'Orazio, M. (2023). Users' vulnerability and exposure in Public Open Spaces (squares): A novel way for accounting them in multi-risk scenarios. Cities, 133, 104160. https://doi.org/10.1016/j.cities.2022.104160
Queiroga, E. F. (2011). Sistemas de espaços livres e esfera pública em metrópoles brasileiras. Resgate: Revista Interdisciplinar de Cultura, 19(1), 25-35. https://doi.org/10.20396/resgate.v19i21.8645703
Robba, F; Macedo, S.S. (2002). Praças Brasileiras: public squares in Brazil. São Paulo. Edusp: Impressa oficial do Estado.
Tedjari, A. F., & Abbaoui, M. (2023). Space Syntax for Evaluating Attractivity and Visit Frequency: A Comparative Study of Two Public Squares of Downtown Setif (Algeria). Engineering, Technology & Applied Science Research, 13(1), 9899-9905. https://doi.org/10.48084/etasr.5455
Vila Velha. (2018). Lei complementar nº 65, de 09 de novembro de 2018. Institui a revisão decenal da lei municipal nº 4575/2007 que trata do plano diretor municipal no âmbito do município de Vila Velha e dá outras providencias. Vila Velha: Câmara Municipal de Vila Velha.
Whyte, William. (2004) The Social Life of Small Urban Spaces. 3rd ed., New York: Project for Public Spaces.
Zhang, X.,B.A.,
Kang, J., & Meng, Q. (2018). Effect of soundscape dimensions on acoustic
comfort in urban open public spaces. Applied acoustics, 133, 73-81. https://doi.org/10.1016/j.apacoust.2017.11.024
DECLARATION OF CONTRIBUTIONS TO THE ARTICLE
|
ROLE |
APassamani |
LRamos |
LJesus |
KCnde |
|
Conceptualization – Ideas; formulation or evolution of overarching research goals and aims. |
x |
x |
x |
|
|
Data curation – Management activities to annotate (produce metadata), scrub data and maintain research data (including software code, where it is necessary for interpreting the data itself) for initial use and later re-use. |
x |
x |
x |
|
|
Formal analysis – Application of statistical, mathematical, computational, or other formal techniques to analyze or synthesize study data. |
|
x |
x |
|
|
Funding acquisition - Acquisition of the financial support for the project leading to this publication. |
x |
x |
x |
x |
|
Investigation – Conducting a research and investigation process, specifically performing the experiments, or data/evidence collection. |
x |
x |
x |
x |
|
Methodology – Development or design of methodology; creation of models. |
|
x |
x |
x |
|
Project administration – Management and coordination responsibility for the research activity planning and execution. |
|
x |
x |
|
|
Resources – Provision of study materials, reagents, materials, patients, laboratory samples, animals, instrumentation, computing resources, or other analysis tools. |
x |
x |
|
|
|
Software – Programming, software development; designing computer programs; implementation of the computer code and supporting algorithms; testing of existing code components. |
x |
|
|
|
|
Supervision – Oversight and leadership responsibility for the research activity planning and execution, including mentorship external to the core team. |
|
x |
x |
|
|
Validation – Verification, whether as a part of the activity or separate, of the overall replication/reproducibility of results/experiments and other research outputs. |
x |
x |
x |
|
|
Visualization – Preparation, creation and/or presentation of the published work, specifically visualization/data presentation. |
x |
x |
x |
|
|
Writing – original draft – Preparation, creation and/or presentation of the published work, specifically writing the initial draft (including substantive translation). |
x |
x |
x |
x |
|
Writing – review & editing – Preparation, creation and/or presentation of the published work by those from the original research group, specifically critical review, commentary or revision – including pre- or post-publication stages. |
x |
x |
x |
|