1. INTRODUCTION
In recent decades, the Brazilian fleet has expanded at an accelerated rate. Between 1999 and 2009, according to Mortaire & Euzébio (2009), the number of automobiles in Brazil increased from 27.1 million to 55.9 million. According to Carvalho & Rabetti (2015), the sale of automobiles increased by 102.6% between 2003 and 2014, while the sale of motorcycles increased by an astounding 269.8%. With so many automobiles traversing the nation daily, a significant number of accidents may also be observed. According to Almeida et al. (2013), traffic accidents in Brazil continue to be a significant health problem necessitating many prevention strategies. Despite the high social cost, these accidents have a direct impact on the national economy, being the direct cause of the high costs demanded by the Unified System of Health, resulting in more than R$ 1.3 billion spent on health care between 2010 and 2015, according to Brasil (2020), Tischer (2019), and Massa & Rosa (2019).
The World Health Organization (WHO) ranked Brazil as the third country with the highest number of traffic-related deaths in 2017. This problem is still exacerbated by the absence of instruments and methods that guarantee successful action. For a more precise study, various other elements, such as the road's physical qualities and driver behavior, must be taken into account. Thus, a basic study of the number of accidents can be sent to the manager, which can result in ineffective judgments.
In the field of decision aid tools, the multicriteria techniques stand out for their robustness and their ability to facilitate the study of more complicated instances. According to Vincke (1992), multicriteria decision support attempts to equip decision-makers with the means to advance the resolution of decision issues involving many, frequently opposing perspectives. The author groups the approaches into three distinct classes. (1) Single-choice techniques of synthesis, originating from the American School, in which the performance of each alternative on a specific set of criteria is considered when constructing an evaluation, the result of which will indicate how well the alternatives are evaluated. In addition to MAUT, other members of this family include SMARTS, TOPSIS, and AHP. (2) Overclassification approaches, which use a pairwise comparison of options to determine which is superior at a given point. This family is represented by PROMETHEE and ELECTRE. They appraised them interactively and consecutively until they converged on a result using Interactive Methods, which combine the decision maker's preference with mathematical foundations.
In the framework of Geographic Information Systems (GIS), knowledge of Statistics, Cartography, and Geography can be combined for spatial data analysis (Scholten & Lepper, 1990; Tesema et al., 2021; Laoluekiat et al., 2022). According to Simões & Bastos (2003), a Geographic Information System (GIS) is a georeferenced tool for the collection, storage, processing, analysis, and dissemination of information that facilitates greater ease, security, and adaptability in human activities related to the study of geographic space. These instruments can conduct a field research to collect data from a specific area and incorporate it into a topographical mapping system (Gontscharow et al., 2020). The GIS application generates a viable study method by facilitating the decision-making process and allowing the geographic visualization of data pertaining to the region under study.
Given the environment described, this study suggests a multicriteria model for decision-making assistance that, by using spatial representation, can provide decision aid for the traffic management process in a county, hence facilitating improved decision-making. In addition, the geographical representation of the collected data can provide managers with valuable insights by allowing them to visualize the relationship between the numerous elements that may influence this process. When qualitative or quantitative variables are considered, they allow for a more comprehensive evaluation of the situation and may provide management directives, allowing for a far more efficient deployment of public resources. Using a GIS, for instance, might supplement the decision-making process by providing a geographic perspective and enabling the display of data that is more relevant to the reality of urban traffic management.
The proposed approach was applied to the Brazilian city of Mossoró-RN, allowing for the classification of this city's highways based on their criticality. Thus, the traffic manager is able to visualize which regions of the city require immediate attention or intervention. This article consists of the sections listed below: The second portion provides an overview of the topic of traffic accidents in Brazil, focusing on the city of Mossoró-RN. In section 3, this research methodology and the proposed multicriteria model are provided. The numerical application and presentation of obtained results are developed in the next section. In section 5, the remarks and conclusion are detailed. In addition, the bibliographic sources used for this study are listed in Section 6.
2. TRAFFIC ACCIDENTS IN BRAZIL
Waiselfisz (2013) notes that between 1981 and 2011, 960,635 traffic-related deaths were recorded in Brazil on a nationwide scale. During this period, an increase of 122% in the number of registered fatalities and 39.75% in the mortality rate for every hundred thousand residents was estimated. According to UN Brazil (ONU Brazil, 2020), the death rate in 2019 was 19.7 per one hundred thousand residents, an increase from the previous year. This index exceeded the average value for the South Cone region, which was assessed at 18.4 deaths, as well as the average for the Americas, which was calculated at 15.6 deaths per 100,000 inhabitants.
The World Health Organization estimates that despite concentrating a little more than half of the world's fleet, low- and middle-income countries alone account for 93% of fatal accidents, and these accidents cost around 3% of their Gross Domestic Product (OPAS, 2019) for these countries. At the national level, according to Carvalho (2015), in 2014, 167,247 accidents were recorded on the highways and in urban areas in Brazil, representing an annual cost of BRL 56 billion, including medical and hospital care, vehicle insurance, damage to public infrastructure, among other expenses. There were 6,743 fatal incidents discovered, resulting in an annual cost of R$4.5 billion.
When analyzing the Brazilian city of Mossoró, information becomes increasingly limited. It is known, according to the official figures of the transit and health agencies of the city that death around 60 persons a year. According to Bezerra (2020), between 2014 and 2017, the city recorded 3,100 incidents with victims (including some form of harm) and 1,645 accidents without victims (involving only property damage). Fernandes (2019) adds that, according to the DATASUS, 941 Authorizations for Hospital Admission connected to fractures were registered and identified as originating from motor vehicle incidents during the study period. However, only 692 were accessed to do their research. According to Fernandes (2019), hospitalizations cost the municipality R$ 280.700 in 2014, R$ 599.700 in 2015, and R$ 269.500 in 2016. Given this circumstance, it can be stated that local traffic is a problem not only owing to the financial element, but also due to the absence of appropriate monitoring and control methods.
3. METHODS
The steps required to conduct this research are depicted in Figure 1 below.
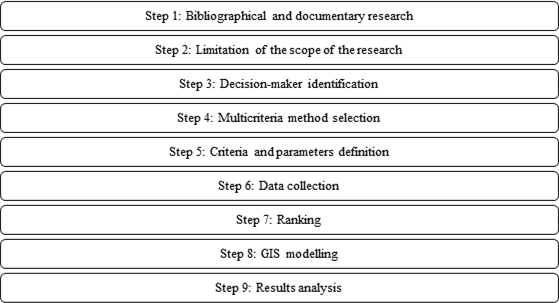
Figure 1. Steps of research
Initially, bibliographic research was conducted on topics relating to the purpose of the study. Then, documentary study was conducted to collect data on traffic accidents worldwide, in Brazil, and in the state of Rio Grande do Norte, where the city of Mossoró is located. In Step 2, the research's scope was defined. Thus, it was agreed to conduct the research in Mossoró, the city where the university is located. In Step 3, the decision-maker whose preferences will be considered by the numerical application was identified. The selected decision-maker was an expert in the field, a Doctor of Transport Engineering, and the coordinator of a research project produced by the Federal Rural University of the Semi-Arid, the University of the State of Rio Grande do Norte, and the transit agencies of the target city. Through discussions with him, it was determined to adopt the categorization problem, i.e., to divide the streets into categories based on their severity.
Then, in Step 4, the multicriteria method was selected based on the preferences structure of the decision maker. The currently preferred approach was PROMSORT (PROMETHEE Sorting). This method was chosen because it provides a solution to the classification problem, as it considers a finite group of alternatives (there is no inclusion of new alternatives after data analysis), for considering verbal and numerical scales, for the non-compensatory character (not allowing direct compensation of performances between criteria), and for allowing the hesitation of decimals to be considered (through preference functions and thresholds).
In Step 5, depending on the selected technique, the criteria and parameters that the decision-maker thinks important to evaluate the criticality of a roadway were defined. Step 6 then involved the collection of road data. A portion of the information was gathered directly from the decision maker, who explained your choices. The Department of Urban Mobility of the city of Mossoró-RN collected technical data and the number of accidents with no injuries. The collection of accidents with victims was conducted in collaboration with the 2nd District of the State Highway Police, which is responsible for the city. Collected information pertaining to the records issued by institutions for each accident between 2015 and 2017, including the coordinates of each accident's location.
In Step 7, the PROMSORT algorithm was employed, and the streets were categorized into one of the three previously determined classes, each of which was modeled as a traffic light: (1) Red class: the most critical roads, which demand managers' urgent attention; (2) Yellow class: roads with medium criticality, which require attention as soon as feasible; (3) Green class: roads in the best condition and not requiring immediate care. It should be mentioned that at this point, 19 streets were removed since they did not provide data relevant to the selected criteria. In Step 8, a geographical representation of the data was obtained with the intent of facilitating managers' examination of the information. In the ninth and last step, the results were discussed.
This research was conducted using the PROMSORT methodology. The approach is based on the PROMETHEE family of methodologies, with PROMETHEE I as its initial step. The approach, which was developed by Araz & Ozkarahan (2007), assigns alternatives to preset, sorted categories. According to Oliveira (2015), to assign a specific alternative to one of the categories, it is necessary to compare that alternative to predetermined values that act as class boundaries and as reference alternatives. According to Araz & Ozkarahan (2007), the execution of the PROMSORT approach consists of three distinct steps:
· Utilizing the PROMETHEE I method for the development of overclassification relations, the positive and negative flows (representing the preference of one alternative over the others) are identified in this step (the degree of preference of all others);
· Using the relationships discovered in the preceding phase to assign alternatives to each previously defined category;
· Proceed with attribution in situations of indifference and incomparability using pairwise comparison.
According to Brans et al. (1998),
PROMETHEE family approaches stand out when involving physical or economic ideas
and parameters that are simple for the decision-maker to comprehend. Brans &
Vincke (1985) point out that, designated ![]() weights, represent
the importance degree for each criterion, the degree of overclassification
weights, represent
the importance degree for each criterion, the degree of overclassification ![]() is computed
according to the equation below:
is computed
according to the equation below:
![]() (1)
(1)
Where ![]() is a number between 0 and 1 that increases as
is a number between 0 and 1 that increases as ![]() increases and equals zero if
increases and equals zero if ![]() . To find the value of the function
. To find the value of the function ![]() , the decision maker can choose, for each criterion, one of the six types
of curves, represented by indifference (q) and preference (p) thresholds: (1)
Criterion usual, when there is no parameter to be defined; (2) Quasi-criterion,
for which it is defined the parameter q; (3) Limit of preference, defining the
parameter p; (4) Pseudo-criterion, considering the parameters q and p; (5) Area
of indifference, considering, also, the parameters q and p; (6) Gaussian
criterion, in which the standard deviation must be fixed.
, the decision maker can choose, for each criterion, one of the six types
of curves, represented by indifference (q) and preference (p) thresholds: (1)
Criterion usual, when there is no parameter to be defined; (2) Quasi-criterion,
for which it is defined the parameter q; (3) Limit of preference, defining the
parameter p; (4) Pseudo-criterion, considering the parameters q and p; (5) Area
of indifference, considering, also, the parameters q and p; (6) Gaussian
criterion, in which the standard deviation must be fixed.
Thus, as the decision maker's preference
increases, with the increase of ![]() , the decision maker chooses, for each criterion, the type of the
function and its associated parameters. These have simple interpretations,
representing thresholds of indifference and preference. Once the values of
, the decision maker chooses, for each criterion, the type of the
function and its associated parameters. These have simple interpretations,
representing thresholds of indifference and preference. Once the values of ![]() are obtained, two complete preorders can be obtained, the first
representing an ordering of actions following order descending numbers
are obtained, two complete preorders can be obtained, the first
representing an ordering of actions following order descending numbers ![]() :
:
![]() (2)
(2)
And another following the ascending
order of the ![]() numbers:
numbers:
 (3)
(3)
After using the PROMETHEE I algorithm, the intersection of these two flows gives the partial pre-order.
In the subsequent step of the PROMSORT application, the categories are established by upper and lower bounds, and the alternatives are compared with the category limits using the overclassification relations discovered in PROMETHEE I. In this manner, the comparison of an alternative with the category limits determines in which class each alternative will be placed, based on the relationships derived from Brans & Vincke's (1985) equations. Alternatives are preferable to class limits under the following circumstances:
 (4)
(4)
Moreover, based on the following equations, the same alternative is indifferent or uncomparable to the class limit if:
![]() (5)
(5)
![]() (6)
(6)
According to Araz & Ozkarahan (2007), using these requirements permits alternative attribution in the selected categories. However, alternatives may not be listed in any category due to their incomparability or indifference. In the subsequent stage, the technique use the assigned alternatives to the categories as a guide for those that have not yet been included.
The difference of the cutoff point ![]() is established: a certain
is established: a certain ![]() point comprises values between 0 and 1, using an optimistic or
pessimistic point of view, through decision-maker choices. If
point comprises values between 0 and 1, using an optimistic or
pessimistic point of view, through decision-maker choices. If ![]() has a value equal to 0, unranked alternatives are allocated
according to their distance functions. When
has a value equal to 0, unranked alternatives are allocated
according to their distance functions. When ![]() they will be assigned to the lowest classes.
they will be assigned to the lowest classes.
![]() (7)
(7)
Where ![]() represents the overclassification of
represents the overclassification of ![]() over all alternatives allocated to a
over all alternatives allocated to a ![]() category, and:
category, and:
Where ![]() represents the overclassification of
represents the overclassification of ![]() over all alternatives allocated to a
over all alternatives allocated to a ![]() category, and:
category, and:
![]() (9)
(9)
![]() being the number of preference alternatives from category
being the number of preference alternatives from category ![]() . Application of the
. Application of the ![]() cutoff point: in the difference is greater than the
cutoff point: in the difference is greater than the ![]() cutoff point, classify the
cutoff point, classify the ![]() alternative to the
alternative to the ![]() category, otherwise to
category, otherwise to ![]()
In the following section, the numerical application is presented.
4. NUMERICAL APPLICATION
The numerical application was conducted taking into account all of the city's streets, excluding the 19 listed in Section 3. In Table 1 the technique and decision-maker were identified, the factors that made a street more critical from the perspective of decision-makers were identified.
Table 1. Criteria considered by the decision maker
|
Code |
Criteria |
Description |
Objective |
Scale |
|
C1 |
Vertical signaling |
Signs on the roads |
Min |
Likert (5 points) |
|
C2 |
Horizontal signaling |
Signs painted on the roads |
Min |
Likert (5 points) |
|
C3 |
Traffic light signaling |
Presence of traffic lights on the roads |
Max |
Numerical |
|
C4 |
Maximum speed |
The maximum speed allowed on the road (30, 40, or 50 km/h) |
Max |
Numerical |
|
C5 |
Width |
The width of the lane, which varies with its type |
Max |
Numerical |
|
C6 |
Accidents without victims |
Occurrences with material damage only |
Max |
Numerical |
|
C7 |
Accidents with victims |
Occurrences of bodily injuries or death |
Max |
Numerical |
|
C8 |
Road conservation |
Indicates the conservation level that the road presents |
Min |
Likert (5 points) |
For the majority of criteria, a quantitative scale was utilized. For the vertical and horizontal signaling criteria, the existence of traffic lights, and road preservation, however, a qualitative scale, which is a verbal scale converted to an ordinal scale, was utilized. Regarding the Width requirement, there are several road classifications: Arterial I (20 meters), Arterial II (18 meters), Collector I (15 meters), Collector II (14 meters), and Streets (12 meters). According to this criterion, the broader the street, the more crucial it is, because drivers tend to speed more.
The decision maker then established the weights for each criterion, which represent the value he assigns to each of them when evaluating the importance of a road. It was instructed to the decision maker that he could freely give values but should remember that a 2X value for a criterion suggests that it is twice as essential as a criterion with an X value. The weights established by the decision-maker are shown in Table 2. Regarding the desired functions of the PROMETHEE approach, it was decided to use the standard function for all criteria. Therefore, any performance disparity between alternatives shows overclassification for that criterion. Using the PROMETHEE method, the input and output flows for each of the pathways were then determined.
Subsequently, limits were defined for ![]() and
and ![]() variables, which delimit the classes. These limits can be
considered fictitious alternatives, whose objective is to determine the
boundaries of the classes, with the alternatives with the worst performance in
relation to
variables, which delimit the classes. These limits can be
considered fictitious alternatives, whose objective is to determine the
boundaries of the classes, with the alternatives with the worst performance in
relation to ![]() class limit belonging to the green class, the alternatives
evaluated between
class limit belonging to the green class, the alternatives
evaluated between ![]() and
and ![]() class limits belonging to the yellow class and those evaluated as
better than
class limits belonging to the yellow class and those evaluated as
better than ![]() class limit belonging to the red class.
class limit belonging to the red class.
To determine the class limits for the number of accidents, the decision maker assessed which limitations for each criterion would describe the classification of a road. As a criterion for the number of accidents, he proposed applying the Pareto Principle. The number of accidents on the 10 percent of routes with the highest accidents is the dividing line between the red and yellow classifications, as determined by the database. The following twenty percent divides the yellow class from the green class. According to criteria, 70 percent of the roads with fewer accidents would be classified as green.
Table 2. Weights and class limits for the application of the PROMSORT method
|
Criterion |
C1 |
C2 |
C3 |
C4 |
C5 |
C6 |
C7 |
C8 |
|
Weight |
0,0740 |
0,0925 |
0,0740 |
0,1851 |
0,1296 |
0,1481 |
0,1851 |
0,1111 |
|
|
1 |
1 |
0 |
30 |
14 |
2 |
2 |
2 |
|
|
3 |
4 |
1 |
50 |
18 |
39 |
54 |
4 |
The PROMSORT approach was applied.
Initially, 22 roads were designated as red and 6 roads were designated as
yellow. The classification of 2179 roads as "green" denotes that they
are low-risk roads. However, sixty streets were not classed in this initial phase
because they were "Incomparable with ![]() ," the first class limit that divides the green and yellow
classes. This statistic reflects 2.64 percent of the city's total number of
streets.
," the first class limit that divides the green and yellow
classes. This statistic reflects 2.64 percent of the city's total number of
streets.
Then, it was necessary to define a cutoff
point with the decision maker for the next PROMSORT method evaluation phase,
which was defined as 0. This point will serve to allocate the alternatives not
allocated in the first phase. Then, a ![]() was found, this one that represents the overclassification of the
alternative about category
was found, this one that represents the overclassification of the
alternative about category ![]() , the lowest category (Green) in this case, and a
, the lowest category (Green) in this case, and a ![]() , this one representing the overclassification of the alterative against
a category
, this one representing the overclassification of the alterative against
a category ![]() , higher, in this case, the yellow category, figure 2.
, higher, in this case, the yellow category, figure 2.
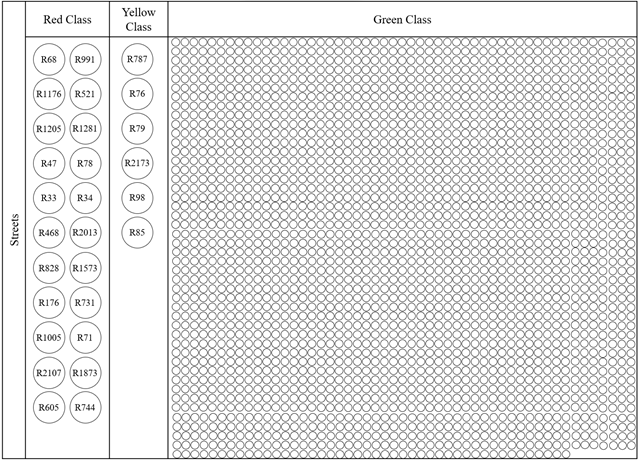
Figure 2. Streets representation after classification
If the net result ![]() is greater than the cutoff point, that is,
is greater than the cutoff point, that is, ![]() , the alternative would be allocated to the Yellow Class. However,
if it is smaller than the cutoff point, it is allocated to the Green Class.
From this operation, these roads ended up being classified in the Green Class.
Thus, Figure 2 shows the result of the classification. In a comparative review
of the city's roads, as depicted in Figure 2, the majority of roads were
positioned in the green category. Tables 3 and 4 display the roads categorized
as red and yellow, respectively.
, the alternative would be allocated to the Yellow Class. However,
if it is smaller than the cutoff point, it is allocated to the Green Class.
From this operation, these roads ended up being classified in the Green Class.
Thus, Figure 2 shows the result of the classification. In a comparative review
of the city's roads, as depicted in Figure 2, the majority of roads were
positioned in the green category. Tables 3 and 4 display the roads categorized
as red and yellow, respectively.
The roads listed in Table 3 require additional attention from public administrators. Eight of these roads are designated as Arterial II, including some of the busiest in the city: Diocesana, Dix-Neuf Rosado, João da Escossia, and Presidente Dutra Avenue. Eight are Collectors I, while three are Collectors II. Except for one, which is paved with parallelepipeds, the remainder are asphalt-paved, with 9 in fair condition, 3 in good condition, and 7 in poor condition. The majority of these are in the city's central district. The beginning of João Falcão Street, which is the entry to a densely populated city area, and Tarcisio Correia Street, which connects the other two neighborhoods, stand out in this distribution. In addition to being nearly all high-speed (11 have a speed of 50 km/h) and having a total of 1,357 incidents with victims and 750 accidents without victims, the roadways depicted in Table 2 are notable for their poor horizontal and vertical signage.
Table 3. Streets allocated in the red class
|
Street Code |
Street Name |
|
R68 |
Presidente Dutra Avenue |
|
R991 |
Francisco Solon Street |
|
R1873 |
Prudente de Morais Street |
|
R1176 |
Jeremias da Rocha Street |
|
R521 |
Coronel Vicente Saboia Street |
|
R2107 |
Tarcísio Correia Street |
|
R1205 |
João Falcão Street |
|
R1281 |
José Damião Street |
|
R71 |
Rio Branco Avenue |
|
R47 |
João da Escossia Avenue |
|
R78 |
SérvuloMarcelino Avenue |
|
R1005 |
Frei Miguelinho Street |
|
R605 |
Delfim Moreira Street |
|
R744 |
Duodecimo Rosado Street |
|
R731 |
Doutor João Marcelino Street |
|
R33 |
Diocesana Avenue |
|
R34 |
Dix-Neuf Rosado Avenue |
|
R176 |
Alfredo Fernandes Street |
|
R468 |
Coelho Neto Street |
|
R2013 |
Santos Dumont Street |
|
R1573 |
Marechal Deodoro Street |
|
R828 |
Felipe Camarão Street |
Two of the yellow class roads are Arterial I, table 4: the R85 in the direction of the city of Fortaleza, and the R98 along the boundary between the neighborhoods of Itapetinga and Bom Jesus. One of them is an Arterial II (Epitácio Pessoa Street, which connects the communities of Bom Jardim and Barrocas), and the others are Collectors II, which are generally important routes inside the neighborhoods that capture the Arterials flow. Each received the lowest score for criteria C1, C2, and C8 (vertical, horizontal signaling, and state of conservation respectively). They also have medium to high speeds, with half of them traveling at 50 km/h and the other half at 40 km/h.
Table 4. Streets allocated in the yellow class
|
Street Code |
Street Name |
|
R787 |
Epitácio Pessoa Street |
|
R76 |
São Jerônimo Avenue |
|
R79 |
Walter Wanderley Avenue |
|
R2173 |
Vicente Fernandes Street |
|
R98 |
RN – 117 (Highway) |
|
R85 |
BR – 304 (Highway) |
A sensitivity study was conducted, focusing on the streets designated as red and yellow. The weights value assigned to each criterion was increased by 20%, while the weights of the other criteria were decreased proportionally, to determine whether the allocation of roads within each class would alter. In general, there was limited difference between positions in the criteria. The streets R68, R994, R1873, and R1176 maintained their places according to all red-class criteria. Only when the accidents without victim’s criterion was increased (C6) did more streets fall into this classification than any other, with a total of 32 streets falling into this category, seven of which were unique streets, that is, streets that did not appear in any other criterion when they were analyzed.
Additionally, locations within the yellow class varied slightly. The adjustment in the number of accidents without victim’s criterion (C6) resulted in a decrease in the number of yellow-class streets, with four of them being reclassified as red (Epitácio Pessoa Street, São Jerônimo Avenue, Walter Wanderley Avenue, and Vicente Fernandes Street). When the weight for the speed criterion (C4) was increased, the number of streets classified as yellow grew to nine, including three streets that did not satisfy any other criterion. These streets were classified as green in the original analysis.
Figure 3 depicts a thematic map resulting from the association of the obtained results with an initial geographical database. These maps enable the management to swiftly assimilate vital information and take the necessary measures.
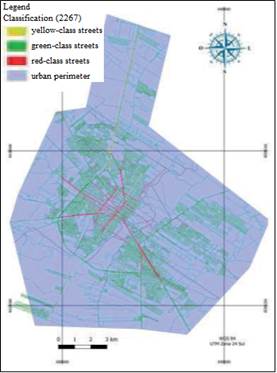
Figure 3. City road map after classification
The analysis of Figure 3 reveals that some of the city's main roads, including (R34) Dix Neuf Rosado Avenue, (R71) Rio Branco Avenue, and (R68) Presidente Dutra Avenue, which connect the city's extreme sides and have a higher volume of traffic, were classified as "red" and require immediate intervention. Additionally, within the GIS, it is possible to zoom in on the map and visually determine which roads belong to each class. This can aid the manager in visualizing the relationship between pathways and understanding the interaction between risk factors and pathways. The spatial representation of the data can be crucial for facilitating communication between all parties involved in traffic management and enabling periodic monitoring of road conditions.
5. CONCLUSION
In Brazil, traffic accidents have become an epidemic that causes social, economic, and human harm. They overburden public health services, which hampers treatment for everyone. In this way, optimizing the decision-making process for prioritizing where public managers should act can yield positive outcomes and maximize the social benefits of the interventions implemented. Given this background, a multicriteria model is developed to aid in decision-making by categorizing the streets into one of three critical classes: red, yellow, and green. For this goal, the PROMSORT approach is offered, which enables the quantitative and qualitative evaluation of several attributes of many possibilities (after processing, 2267 unique streets were reached). Then, the gathered data were geographically represented, and it was possible to determine which locations are most crucial for the performance of public managers.
The study's limitations are highlighted. Due to the high turnover of individuals who make choices regarding traffic, the parameters established by the decision-maker can be modified often in practice. Moreover, the model application is contingent upon the efforts of managers who can begin working in the traffic and urban mobility management sector after each public election to comprehend its significance. Another drawback was that only one decision-maker was considered. As such, it is suggested, as a suggestion for future work, that the model be adapted to a situation with numerous decision-makers.
6. REFERENCES
Almeida, R. L. F. D., Bezerra Filho, J. G., Braga, J. U., Magalhaes, F. B., Macedo, M. C. M., & Silva, K. A. (2013). Via, homem e veículo: fatores de risco associados à gravidade dos acidentes de trânsito. Revista de Saúde Pública, 47, 718-731. https://doi.org/10.1590/S0034-8910.2013047003657
Araz, C., & Ozkarahan, I. (2007). Supplier evaluation and management system for strategic sourcing based on a new multicriteria sorting procedure. International journal of production economics, 106(2), 585-606. https://doi.org/10.1016/j.ijpe.2006.08.008
Bezerra, A. L. F. (2020). Aplicação do Princípio de Pareto e Mapa de Calor na análise de acidentes de trânsito em Mossoró/RN. In: Engineering Center, Federal Rural University of Semi-Árid, Mossoró, RN, Brazil.
Brans, J. P., & Vincke, P. (1985). Note—A Preference Ranking Organisation Method: (The PROMETHEE Method for Multiple Criteria Decision-Making). Management science, 31(6), 647-656. https://doi.org/10.1287/mnsc.31.6.647
Brans, J. P., Macharis, C., Kunsch, P. L., Chevalier, A., & Schwaninger, M. (1998). Combining multicriteria decision aid and system dynamics for the control of socio-economic processes. An iterative real-time procedure. European Journal of Operational Research, 109(2), 428-441. https://doi.org/10.1016/S0377-2217(98)00068-X
Brazil. (2020). Ministro da Saúde apresenta dados e ações para segurança no trânsito. Ministério da Saúde. Governo Federal do Brasil. Recovered from https://www.saude.gov.br/noticias/agencia-saude/29654-ministro-dasaude-apresenta-dados-e-acoes-para-seguranca-no-transito.
Carvalho, C. H. R. (2015). Estimativa dos custos dos acidentes de trânsito no Brasil com base na atualização simplificada das pesquisas anteriores do Ipea. Brasília, Instituto de Pesquisa Econômica Aplicada. Recovered from http://repositorio.ipea.gov.br/handle/11058/7456.
Carvalho, C. H. R., Rabetti, M. S. (2015). Acidentes de trânsito nas rodovias federais brasileiras: caracterização, tendências e custos para a sociedade. Brasília, Instituto de Pesquisa Econômica Aplicada. Recovered from http://repositorio.ipea.gov.br/handle/11058/7493.
Fernandes, R. M. F. (2019). Aplicação da ferramenta SIG para análise de acidentes de trânsito em Mossoró - RN. In: Centro de Engenharias, Universidade Federal Rural do Semi Árido, Mossoró.
Gontscharow, T. C., Marques, S. M., Lima, C. G. R., & Lollo, J. A. (2018). Experiência na capacitação de gestores públicos em sistemas de informação geográfica. Revista Brasileira de Extensão Universitária, 9(3), 157-163. https://doi.org/10.24317/2358-0399.2018v9i3.8198
https://www.paho.org/bra/index.php?option=com_content&view=article&id=5147:acidentes-de-transito-folha-informativa&Itemid=779.
Laoluekiat, S., Chottanapund, S., Iabchoon, S., & Chodpathumwan, Y. (2022). Spatial Data Application on Health (COVID-19) in Health Region 6 of Thailand. Open Journal of Applied Sciences, 12(8), 1395-1401. https://doi.org/10.4236/ojapps.2022.128096
Massaú, G. C., & da Rosa, R. G. (2016). Acidentes de trânsito e direito à saúde: prevenção de vidas e economia pública. Revista de Direito Sanitário, 17(2), 30-47. https://doi.org/10.11606/issn.2316-9044.v17i2p30-47
Mortaire, R., & Euzébio, G. L. (2009). O custo do caos: Prejuízo ao bolso e ao meio ambiente – cidades não suportam mais o crescimento da frota de veículos. Brasília, Desafios do desenvolvimento, Instituto de Pesquisa Econômica Aplicada, v.53. Recovered from https://www.ipea.gov.br/desafios/index.php?option=com_content&id=1252:reportagensmaterias&Itemid=39.
Nações Unidas Brasil. (2020). Região das Américas registra quase 155 mil mortes no trânsito por ano, diz agência da ONU. Organização das Nações Unidas. Recovered from https://nacoesunidas.org/regiao-das-americasregistra-
Oliveira, E. L. B. (2015). Modelo de apoio a decisão para alocação de projetos (Doctoral thesis). Programa de Pós-Graduação em Engenharia de Produção, Universidade Federal do Pernambuco, Recife, PE, Brazil.
PAHO (2019). Folha informativa - Acidentes de trânsito. Pan American Health Organization. Recovered from
quase-155-mil-mortes-no-transito-por-ano-diz-agencia-da-onu/.
Roy, B., & Słowiński, R. (2013). Questions guiding the choice of a multicriteria decision aiding method. EURO Journal on Decision Processes, 1(1-2), 69-97. https://doi.org/10.1007/s40070-013-0004-7
Scholten, H. J., & De Lepper, M. J. (1991). The benefits of the application of geographical information systems in public and environmental health. World Health Statistics quarterly. Rapport Trimestriel de Statistiques Sanitaires Mondiales, 44(3), 160-170.
Simões, C. R. M., & Bastos, L. C. (2003). Um sistema de informações geográficas para auxiliar a administração universitária: desenvolvimento de um protótipo para a UFSC. In: 11th Simpósio Brasileiro de Sensoriamento Remoto, pp. 1011-1018. Santa Catarina, SC.
Tesema, A.K., Liyew, A. M., Alem, A. Z., Yeshaw, Y., Tesema, G. A., & Teshale, A. B. (2021). Spatial distribution and determinants of undernutrition among reproductive age women of Ethiopia: A multilevel analysis. Plos one, 16(9), e0257664. https://doi.org/10.1371/journal.pone.0257664
Tischer, V. (2019). O custo social e econômico dos acidentes de trânsito com pedestres e ciclistas :estudo de caso do estado de Santa Catarina, Brasil. Revista Brasileira de Gestão Urbana 11(0), 1-14. https://doi.org/10.1590/2175-3369.011.001.ao12
Vincke, P. (1992). Multicriteria decision-aid. Londres: John Wiley & Sons, 1st ed.
Waiselfisz, J. J. (2013). Mapa da Violência 2013: Acidentes de Trânsito e Motocicletas. Rio de Janeiro, RJ. Centro Brasileiro de Estudos Latino-Americanos, Faculdade Latino-Americana de Ciências Sociais Brasil. Recovered from https://flacso.org.br/files/2020/03/mapa2013_transito.pdf.
WHO (2020a). Road traffic injuries. World Health Organization. Recovered from https://www.who.int/en/news-room/factsheets/detail/road-traffic-injuries.
WHO (2020b). Década de Ação para a Segurança Viária 2011-2020 busca salvar milhões de vidas. World Health Organization. Recovered from https://www.who.int/roadsafety/decade_of_action/en.
DECLARATION OF CONTRIBUTIONS TO THE ARTICLE – CrediT
|
ROLE |
ABezerra |
MDamasceno |
CSouza |
JPeixoto |
TGonçalo |
EFerreira |
|
Conceptualization – Ideas; formulation or evolution of overarching research goals and aims. |
X |
X |
X |
X |
X |
X |
|
Data curation – Management activities to annotate (produce metadata), scrub data and maintain research data (including software code, where it is necessary for interpreting the data itself) for initial use and later re-use. |
X |
|
|
|
|
|
|
Formal analysis – Application of statistical, mathematical, computational, or other formal techniques to analyze or synthesize study data. |
X |
|
|
|
X |
|
|
Funding acquisition - Acquisition of the financial support for the project leading to this publication. |
|
|
|
X |
X |
X |
|
Investigation – Conducting a research and investigation process, specifically performing the experiments, or data/evidence collection. |
X |
|
|
|
X |
|
|
Methodology – Development or design of methodology; creation of models. |
X |
|
|
|
X |
|
|
Project administration – Management and coordination responsibility for the research activity planning and execution. |
|
|
|
|
X |
|
|
Resources – Provision of study materials, reagents, materials, patients, laboratory samples, animals, instrumentation, computing resources, or other analysis tools. |
X |
|
|
|
X |
|
|
Software – Programming, software development; designing computer programs; implementation of the computer code and supporting algorithms; testing of existing code components. |
|
|
|
|
|
|
|
Supervision – Oversight and leadership responsibility for the research activity planning and execution, including mentorship external to the core team. |
|
|
|
X |
X |
X |
|
Validation – Verification, whether as a part of the activity or separate, of the overall replication/reproducibility of results/experiments and other research outputs. |
X |
X |
X |
X |
X |
|
|
Visualization – Preparation, creation, and/or presentation of the published work, specifically visualization/data presentation. |
X |
X |
X |
X |
X |
|
|
Writing – original draft – Preparation, creation, and/or presentation of the published work, specifically writing the initial draft (including substantive translation). |
X |
X |
X |
X |
X |
|
|
Writing – review & editing – Preparation, creation, and/or presentation of the published work by those from the original research group, specifically critical review, commentary, or revision – including pre- or post-publication stages. |
|
X |
|
X |
X |
|