|
Revista Produção e Desenvolvimento Research in Production and Development |
eISSN: 2446-9580 Doi: https://doi.org/10.32358/rpd.2022.v8.612 |
FLEURIET ACCOUNTING MODEL FOR DECISION-MAKING IN BRAZILIAN AGRICULTURAL AND PROCESSED FOOD SUBSECTORS
|
Willy Figueiredo Carneiro1*, willyfcarneiro@gmail.com, https://orcid.org/0000-0002-9314-4980 Edson Vinicius Pontes Bastos2, edson.bastos@coppe.ufrj.br, https://orcid.org/0000-0002-6948-6390
1 Independent Researcher, Rio de Janeiro-RJ, Brazil 2 Federal University of Rio de Janeiro, 21941-914, Rio de Janeiro-RJ, Brazil
|
Submitted: 24/11/2022. Accepted: 22/12/2022
Published:29/12/2022
ABSTRACT
Purpose: this article aims to apply a model to assess the financial and accounting situation of companies in the selected Agricultural and Processed Food and Livestock economic subsectors, using accounting analysis tools and statistical support identify correlations between the fleuriet dynamic model indicators with traditional indicators and stock market indicators.
Methodology/Approach: This research is framed as a documental study with B3 portal information at the national level of companies operating in Brazil.
Findings: The dynamic model indicators are correlated with both traditional indicators and stock market indicators, but with the exception of a few isolated cases, the ROI and ROE indicators did not have such a high correlation rate with the others. There was a high correlation between the indicators CDG, NDG and T, with positive and negative variations depending on the studied typology.
Research Limitation/implication: can register not full disponible of the company's market values for the survey recent years so that the statistical analysis could be carried out using these data.
Originality/Value of paper: Fleuriet's dynamic model appears as an alternative tool, which can be used in order to identify the real financial situation of organizations and thus generate more confidence in managers for decision-making.
KEYWORD: fleuriet, decision-making, food sector, accounting, market value.
MODELO CONTÁBIL FLEURIET PARA A TOMADA DE DECISÃO NOS SUBSETORES AGROPECUÁRIOS E DE ALIMENTOS PROCESSADOS BRASILEIROS
RESUMO
Objetivo: este artigo tem como objetivo aplicar um modelo para avaliar a situação financeira e contábil de empresas dos subsetores econômicos Agropecuários e Agropecuários selecionados, usando ferramentas de análise contábil e suporte estatístico identificar correlações entre os indicadores do modelo dinâmico fleuriet com indicadores tradicionais e estoque indicadores de mercado.
Metodologia/Abordagem: Esta pesquisa enquadra-se como um estudo documental com informações do portal B3 em nível nacional de empresas que atuam no Brasil.
Resultados: Os indicadores do modelo dinâmico estão correlacionados tanto com os indicadores tradicionais quanto com os indicadores do mercado de ações, mas com exceção de alguns casos isolados, os indicadores ROI e ROE não tiveram uma taxa de correlação tão alta com os demais. Houve alta correlação entre os indicadores CDG, NDG e T, com variações positivas e negativas dependendo da tipologia estudada.
Limitação/implicação da pesquisa: pode-se registrar indisponibilidade total dos valores de mercado da empresa para a pesquisa dos últimos anos para que a análise estatística pudesse ser realizada a partir desses dados.
Originalidade/Valor do papel: O modelo dinâmico de Fleuriet surge como uma ferramenta alternativa, que pode ser utilizada a fim de identificar a real situação financeira das organizações e assim gerar mais confiança nos gestores para a tomada de decisões.
Palavras-Chave: fleuriet, tomada de decisão, setor alimentício, contabilidade, valor de mercado.
1. INTRODUCTION
Different sectors of the world economy have sought ways to reinvent themselves to stay competitive in the market (Mellett & O'brien, 2014). It is essential that new tools be used to assist and provide a basis for decision-making. Given the importance of accounting indicators for evaluating performance and competitiveness, authors such as Ambrozini et al. (2014), Avelar & Souza (2018), Cavalcanti & Longhini (2016), Amorim et al. (2021) and Rosa et al., (2021) emphasize that the assessment should not be restricted to the static analysis of liquidity indicators traditionally used in financial statement analysis. They point the importance of using the dynamic model (or Fleuriet model), which essentially emphasizes the analysis of accounts related to the management of the company's working capital.
The management of working capital, specifically, allows the organization's analysis activities to provide an assertive support for decision-making, especially in the management of resources and results in the short term (Cavalcanti & Longhini, 2016). Avelar & Souza (2018) report that access to financing tends to be complex, and depends on the available working capital that comes from the operational process of generating profits in a company.
Given the concern of managers and society in relation to the financial capacity of organizations (Bastos, 2020), the objective of this article is to apply a model to assess the financial and accounting situation of companies in the selected Agricultural and Processed Food and Livestock economic subsectors, using accounting analysis tools and statistical support identify correlations between the fleuriet dynamic model indicators with traditional indicators and stock market indicators.
Given the current global economic scenario, it is essential that companies seek ways of control to overcome the impacts of the crisis. The historical results obtained by sets of statistical techniques and methods serve as a warning to managers that something is not well planned (Bastos & Mello, 2019; Bastos, 2020). An analysis of the financial and accounting aspects is important and a vital contribution to managers working portfolio investments. According to Ambrozini et al. (2014), this analysis should not be done statically on working capital or other traditional liquidity indicators.
The relevance of the present study is evidenced at the moment when it is possible to perceive that the use of financial and accounting assessment tools as an aid in decision making is still not a widespread resource, especially among small and medium-sized companies (Burrit & Christ, 2021; Freitas et al., 2022). Fleuriet's dynamic model appears as an alternative tool, which can be used in order to identify the real financial situation of organizations and thus help in the strategic formulation that will be followed, in addition to generate more confidence in managers for short decision-making.
2. LITERATURE REVIEW
The analysis of a company's operating results is very important to understand the strengths and weaknesses of the business, thus knowing the company's finances in order to generate actions that seek corporate development. This information is even used as an instrument by investors (Couto et al., 2012).
Financial performance can be obtained in different ways through indicators (Costa et al., 2019; Silva & Mello, 2021), which are metrics calculated using data obtained from the business results statements, helping to analyze performance organizational and decision-making (Silva et al., 2020). In the business context, financial analysis are fundamental in decision making, serving as an input for the company to have the ability to understand its market situation and take advantage of opportunities (Enqvist et al., 2014).
The perspective of Fleuriet's dynamic model enables the assessment of companies liquidity from a working capital perspective to aid decision-making (Palombini & Nakamura, 2012; Zanolla & Silva, 2017; Chiachio & Martinez, 2019). Fleuriet's dynamic model proposes an alternative to the traditional model and reclassifies the balance sheet for an analysis from another perspective according to the company's operations (Bastos, 2020). As can be seen in Table 01, the information on Assets and Liabilities of the balance sheet is divided between Cyclic, Permanent and Erratic.
Table 01: Reclassification of the Balance Sheet.
|
Balance Sheet |
|||
|
Asset |
Liability |
||
|
Current assets |
Current liabilities |
||
|
Erratic |
cash amounts |
Erratic |
Loans |
|
Financial investments |
Dividends payable |
||
|
Cyclics |
Product stocks |
Cyclics |
Providers |
|
advance to suppliers |
wages to pay |
||
|
Prepaid expenses |
taxes and fees |
||
|
Permanent |
Non-current asset |
Permanent |
Non-current liabilities |
|
Investments |
long-term due |
||
|
long-term achievable |
Net equity |
||
|
|
Permanent |
share capital |
|
|
capital reserves |
|||
|
Equity valuation adjustments |
|||
|
Stock in treasury |
|||
Source: Adapted from Silva (2016), Fleuriet et al. (2003) e Bastos (2020).
According to Silva (2016), Erratic accounts are those that are essentially financial in nature, for example, in assets, bank accounts, immediate liquidity investments, already in liabilities, discounted trade bills, loans, short-term financing that are presented in accordance with the economic structure and financial risk assumed by the company with greater or lesser liquidity.
In this context, Cyclic accounts are the short-term ones related to the company's operating expenses and gains, such as costs of materials, suppliers, sales revenue, etc. On the other hand, Permanent or Non-Cyclic accounts can be classified by their slow conversion into resources for the company (Silva, 2016). Thus, the dynamic model jointly presents the behavior and evolution of liquidity through three variables: Working Capital (CDG), Working Capital Need (NDG) and Treasury Balance (T) (Fleuriet et al., 2003).
Working capital
According to the model proposed by Fleuriet, the Working Capital equation is defined as the difference between Permanent Liabilities and Permanent Assets (FLEURIET et al., 2003):
CDG = Permanent Liabilities - Permanent Assets (Equation 01)
Permanent assets and liabilities are non-cyclical accounts, in this way, if the company knows how to satisfactorily manage the CDG, it can achieve good results regardless of low liquidity (BASTOS, 2017).
Need for working capital
According to the dynamic model, the definition of the Working Capital Need equation is said as the difference between Cyclic Assets and Cyclic Liabilities (FLEURIET; KEHDY; BLANC, 2003):
NDG = Cyclic Assets - Cyclic Liabilities (Equation 02)
According to Assaf (2002), when cash outflows are created before the expected inflows, the Working Capital Need is evidenced. This can occur when short-term operating accounts (purchases, payments, suppliers, etc.) are larger than what was planned to be received (sales). This situation creates a constant need to invest in the company's working capital.
Treasury Balance
Thus, an equation for the Treasury Balance is defined following Fleuriet's model as the difference between Erratic Assets and Erratic Liabilities:
T = Erratic Asset - Erratic Liability (Equation 03)
It is also possible to define the Treasury Balance as the difference between the CDG and the NDG (Monteiro, 2003). The result of this difference can demonstrate the company's insolvency. If the value of T is negative, it means that the Working Capital is not sufficient to finance the Working Capital Need (ASSAF, 2002)
Classification
After obtaining the CDG, NDG and T values, the dynamic model classifies the company among 6 types, depending on the positive or negative values of the indicators. According to Cavalcanti and Longhin (2016), each type is described as follows:
Type 1: The NDG represents a source of operational resources that, added to the long-term resources provided by the CDG, are applied in the short term in T, keeping the risk levels low.
Type 2: The long-term resources of the CDG are sufficient to finance NDG and the company still has a surplus for investment in T, thus maintaining a liquidity base.
Type 3: The NDG is positive, showing an operational demand that is financed through a composition of long-term resources from the CDG and short-term resources from T.
Type 4: The NDG represents an operational demand for resources that needs to be financed. However, the company does not have long-term resources from the CDG. Thus, the treasury balance is responsible for financing the NDG and the CDG. This is a high-risk situation.
Type 5: Funds originating from NDG are complemented by short-term funds from T for financing the CDG. It is a very delicate situation, as part of the long-term investments is being financed through short-term resources.
Type 6: In CDG, there is a balance of long-term investments to be financed. The availability of operating resources is, however, sufficient to finance this long-term balance and still allow for the existence of a surplus for investment in T.
Insolvency prediction models offer analysts and credit managers an advanced tool, free from subjective influences and which enables them to classify the "financial health" of companies. (Mathiasi Horta, 2016).
3. METHODOLOGY
This research is framed as a documental study with information at the national level of companies operating in Brazil. The information and accounting data were obtained through the B3 portal, the main stock exchange in Brazil. Information from the balance sheets and stock market of companies in the Agriculture and Food Processed subsectors between the years 2009 to 2017 was used.
Through the balance sheet data available on the B3 portal, all information necessary for the application of the Fleuriet model (Bastos, 2020) and the traditional financial analysis, proposed by studies such as Matarazzo & Pestana (1994) and Anton et al. (2020). The study line the integration of BM&FBOVESPA and Cetip in 2017, which gave rise to Brasil Bolsa Balcão (B3), consolidating itself as the largest financial market infrastructure company in Brazil, and one of the main companies in the world scenario, integrating the Ibovespa, IBrX-50, IBrX and Itag indicators, among others. Because of this importance for the market, the B3 economic subsectors of Agriculture and Processed Food were chosen as the objects of the study.
In addition, as a limitation, can register not full disponible of the company's market values for the survey recent years so that the statistical analysis could be carried out using these data, which sought to assess the correlation between the market value and the result of the dynamic Fleuriet model of sector companies. According to Marconi and Lakatos (2003, p. 167), analysis “is the attempt to show the existing relation between the studied phenomenon and other factors”. Thus, initially all collected data were organized in a data tabulation software for better analysis and interpretation of the research object. Fleuriet's model provides an analytical view of the company and effectively reveals the need for working capital and the best way to apply it (Silveira et al., 2015) through the segregation of current (short-term) equity elements into cyclical and erratic. In this context, according to Braga et al. (2004), Fleuriet's model defines the quality of the financial situation of companies based on the configuration of certain patrimonial elements, without the need to perform interpretations to arrive at a diagnosis, unlike traditional analyzes that require an effort of interpretation.
The relevance of economic-financial management using the Fleuriet model was found in studies carried out by Ambrozini et al. (2014), Cavalcanti and Longhin (2016), Bastos and Mello (2019), Bastos (2020) who study models that help decision-making and planning. After tabulation, following the guidelines of Bastos (2020), the data were submitted to Fleuriet's dynamic model and, in this way, the main variables of the model were calculated for each company, which are, Working Capital, Working Capital Need and o Balance T, and based on the analysis, companies were classified into 6 types, according to the model.
In parallel, all available information on the market value of companies was surveyed according to the market value and then a statistical analysis in order to identify the existence or not of correlation between the company's classification according to the Fleuriet model and the market value. Based on the data from the analysis, a qualitative assessment was made of the information and suggestions for possible new studies that could further deepen the subject explored.
This study has as a restricted universe the list of companies listed in the B3 database that belong to the Agriculture and Food Processed subsectors, according to the information in their balance sheets. These are: ALIPERTI, BIOSEV, BRASILAGRO, BRF AS, CAMIL, CTC S.A., EXCELSIOR, FORNODEMINAS, J.MACEDO, JBS, JOSAPAR, M.DIASBRANCO, MARFRIG, MINERVA, MINUPAR, ODERICH, POMIFRUTAS, RAIZEN ENERG, SAO MARTINHO, SLC AGRICOLA, TERRA SANTA.
For a good comparative basis, and to prevent specific events from influencing the survey, the results for the period from 2009 to 2017 listed in the respective companies' balance sheets were chosen. “In general, the quantification of an association degree between two variables is done by the so-called association or correlation coefficients. These are measures that describe, through a single number, the association (or dependence) between two variables” (Bussab & Morettin, 2010, p.76). The main objective of applying statistical correlation was to study the relation between the indicators obtained through Fleuriet's dynamic model, the indicators that are traditionally used and some indicators related to the performance of companies in the stock market. In this sense, the correlation was performed only with companies that had their typology defined between some of the types of the dynamic model.
Three indicators were chosen to carry out the survey, these are the number of trades carried out during the year (Neg.), number of shares traded (Qtd.), and volume of shares sold in reais (Vol.). The trading volume at B3 has grown since 2015, being the highest result ever recorded in 2018, with an average daily financial volume traded of 10.8 billion reais. The market sale is made through the cash or fractional market, in the first, the shares are divided into standard lots defined by the company itself, for example, 10, 100, 1,000, whereas in the fractional market, the shares are purchased in a unitary manner, which is important for investors with few resources.
The analysis was prepared for companies that had all the information available in accordance with the expected definitions. For the indicators correlation, the variables were standardized to create differences between the magnitude of the indicators, which are influenced by the size of the companies, to not impact the result of applied model.
4. CHARACTERISTICS OF THE STUDIED SECTOR
This research focused on the study of companies listed on B3 classified in the subsectors of Agriculture and Processed Food, with information available on its portal during the period from 2009 to 2017, totaling 9 years of analysis. At the beginning of the study, the number of companies that were part of the chosen sub-sectors surveyed was 21, but during data collection, some companies did not present the necessary information for the study to be carried out. Below, table 02 shows the list of companies included in the chosen subsectors:
Table 02: List of companies in the chosen subsectors.
|
Trading Name |
Corporate Name |
Segment |
|
ALIPERTI |
SIDERURGICA J. L. ALIPERTI S.A. |
Agriculture |
|
BIOSEV |
BIOSEV S.A. |
Sugar and alcohol |
|
BRASILAGRO |
BRASILAGRO - CIA BRAS DE PROP AGRICOLAS |
Agriculture |
|
BRF AS |
BRF S.A. |
Meat & Derivatives |
|
CAMIL |
CAMIL ALIMENTOS S.A. |
Miscellaneous Food |
|
CTC S.A. |
CTC - CENTRO DE TECNOLOGIA CANAVIEIRA S.A. |
Agriculture |
|
EXCELSIOR |
EXCELSIOR ALIMENTOS S.A. |
Meat & Derivatives |
|
FORNODEMINAS |
FORNO DE MINAS ALIMENTOS S.A. |
Miscellaneous Food |
|
J.MACEDO |
J. MACEDO S.A. |
Miscellaneous Food |
|
JBS |
JBS S.A. |
Meat & Derivatives |
|
JOSAPAR |
JOSAPAR-JOAQUIM OLIVEIRA S.A. - PARTICIP |
Miscellaneous Food |
|
M.DIASBRANCO |
M.DIAS BRANCO S.A. IND COM DE ALIMENTOS |
Miscellaneous Food |
|
MARFRIG |
MARFRIG GLOBAL FOODS S.A. |
Meat & Derivatives |
|
MINERVA |
MINERVA S.A. |
Meat & Derivatives |
|
MINUPAR |
MINUPAR PARTICIPACOES S.A. |
Meat & Derivatives |
|
ODERICH |
CONSERVAS ODERICH S.A. |
Miscellaneous Food |
|
POMIFRUTAS |
POMIFRUTAS S/A |
Agriculture |
|
RAIZEN ENERG |
RAIZEN ENERGIA S.A. |
Sugar and alcohol |
|
SAO MARTINHO |
SAO MARTINHO S.A. |
Sugar and alcohol |
|
SLC AGRICOLA |
SLC AGRICOLA S.A. |
Agriculture |
|
TERRA SANTA AGRO S.A. |
Agriculture |
Source: Author.
4.1 – Result Analysis
Through the dynamic model, the companies studied were classified into 4 different groups according to their typologies, "Type 2 - Solid", "Type 3 - Unsatisfactory", "Type 5 - Very Bad" and "No defined standard". The dynamic model uses three financial indicators to classify companies, and following this concept, the values for CDG, NDG and T were calculated for each company as shown in the previous item. Next, it is possible to observe Table 01 with the results of the analysis according to the classifications of the Fleuriet model:
Table 01: General result of the Fleuriet model.
|
COMPANY |
2009 |
2010 |
2011 |
2012 |
2013 |
2014 |
2015 |
2016 |
2017 |
Type |
|
ALIPERTI |
3 |
3 |
3 |
3 |
3 |
2 |
2 |
2 |
2 |
Undefined |
|
BRF AS |
2 |
3 |
3 |
3 |
3 |
2 |
2 |
2 |
3 |
Undefined |
|
EXCELSIOR |
4 |
3 |
4 |
4 |
3 |
2 |
2 |
2 |
2 |
Undefined |
|
JBS |
3 |
3 |
3 |
3 |
3 |
3 |
3 |
3 |
3 |
3 |
|
M.DIASBRANCO |
3 |
3 |
3 |
3 |
3 |
2 |
3 |
2 |
2 |
Undefined |
|
MARFRIG |
2 |
3 |
2 |
3 |
2 |
2 |
2 |
2 |
2 |
Undefined |
|
MINERVA |
2 |
2 |
2 |
2 |
2 |
2 |
2 |
2 |
2 |
2 |
|
MINUPAR |
5 |
5 |
5 |
5 |
5 |
5 |
5 |
5 |
5 |
5 |
|
POMIFRUTAS |
4 |
4 |
4 |
4 |
3 |
3 |
4 |
3 |
5 |
Undefined |
|
TERRA SANTA |
2 |
3 |
4 |
3 |
3 |
4 |
4 |
4 |
4 |
Undefined |
|
SLC AGRICOLA |
3 |
3 |
3 |
3 |
3 |
3 |
3 |
3 |
3 |
3 |
|
JOSAPAR |
3 |
3 |
3 |
3 |
3 |
3 |
3 |
3 |
3 |
3 |
|
ODERICH |
3 |
3 |
3 |
3 |
3 |
3 |
3 |
3 |
3 |
3 |
|
J.MACEDO |
3 |
3 |
2 |
3 |
3 |
3 |
3 |
3 |
2 |
Undefined |
Source: Authors
As noted, only 6 companies could be classified into any of the dynamic model types consistently over the period under review, the others did not show any definite trend. Thus, the correlation study followed with companies defined in specific types, following their respective classifications.
Only the company MINERVA was classified with a Solid profile, and in its specific case an evolution was observed in its CDG indicator. In this profile, the NDG index is positive, which demonstrates a need for capital to fund its activities, but as the CDG and T indicators are positive, they end up meeting this need.
The companies JBS, JOSAPAR, and SLC AGRICOLA were classified as Type 3 – Unsatisfactory, thus their CDG indicator remained positive, with a certain evolution in the period analyzed. Even so, in this case, CDG does not supply NDG as a result of negative T, which shows that the company cannot cover its costs in the short term. Only the company MINUPAR had its classification as Type 5 – Very Bad, with its negative CDG index and showing deterioration after some fluctuations. In this situation, CDG and T are negative, which shows the need for resources both in the short and long term, but despite this value, their Working Capital Need is negative, which makes this situation considered better than Type 4. The other companies could not be classified into any specific typology, but it was possible to observe a smaller variation in the final period of the study, which may demonstrate profile stability in the sector.
4.2 Traditional Indicators
After classifying the companies in the types of the Fleuriet model, 3 types were identified, "Type 2 - Solid", "Type 3 - Unsatisfactory", "Type 5 - Very Bad" and "No defined standard". In this sense, the traditional indicators, table 2, of the companies which the correlation analyzes were carried out were raised.
Table 02: Traditional company indexes.
|
|
indexes |
2009 |
2010 |
2011 |
2012 |
2013 |
2014 |
2015 |
2016 |
2017 |
|
MINERVA |
LI |
0,247 |
0,281 |
0,234 |
0,431 |
0,533 |
0,816 |
0,656 |
1,026 |
0,831 |
|
LC |
2,278 |
2,39 |
1,737 |
2,146 |
2,122 |
2,171 |
1,648 |
2,013 |
1,863 |
|
|
LS |
1,925 |
2,088 |
1,565 |
1,945 |
1,904 |
1,934 |
1,505 |
1,852 |
1,679 |
|
|
ILNDG |
0,224 |
0,701 |
0,222 |
0,811 |
0,814 |
0,997 |
0,169 |
0,851 |
0,478 |
|
|
IE |
0,091 |
0,062 |
0,048 |
0,05 |
0,059 |
0,065 |
0,052 |
0,051 |
0,061 |
|
|
ROI |
0,035 |
0,009 |
0,012 |
-0,046 |
-0,063 |
-0,058 |
-0,096 |
0,022 |
-0,024 |
|
|
ROE |
0,139 |
0,042 |
0,068 |
-0,264 |
-0,708 |
-0,87 |
2,09 |
0,374 |
-3,949 |
|
|
JBS |
LI |
0,489 |
0,193 |
0,216 |
0,169 |
0,266 |
0,337 |
0,268 |
0,168 |
0,202 |
|
LC |
1,478 |
1,522 |
1,725 |
1,68 |
1,633 |
1,51 |
1,241 |
1,017 |
1,237 |
|
|
LS |
1,09 |
1,024 |
1,192 |
1,218 |
1,234 |
1,177 |
0,964 |
0,729 |
0,905 |
|
|
ILNDG |
-0,179 |
-0,245 |
-0,051 |
-0,143 |
-0,124 |
-0,031 |
-0,347 |
-0,947 |
-0,305 |
|
|
IE |
0,079 |
0,106 |
0,114 |
0,104 |
0,101 |
0,101 |
0,091 |
0,093 |
0,089 |
|
|
ROI |
0,005 |
-0,006 |
-0,007 |
0,015 |
0,016 |
0,029 |
0,042 |
0,007 |
0,009 |
|
|
ROE |
0,011 |
-0,014 |
-0,015 |
0,036 |
0,048 |
0,093 |
0,173 |
0,028 |
0,039 |
|
|
JOSAPAR |
LI |
0,006 |
0,005 |
0,009 |
0,018 |
0,007 |
0,015 |
0,017 |
0,013 |
0,019 |
|
LC |
1,477 |
1,586 |
1,706 |
2,145 |
1,711 |
2,019 |
1,555 |
1,78 |
2,096 |
|
|
LS |
1,222 |
1,249 |
1,23 |
1,584 |
1,305 |
1,518 |
1,172 |
1,333 |
1,69 |
|
|
ILNDG |
-0,445 |
-0,379 |
-0,432 |
-0,176 |
-0,34 |
-0,235 |
-0,467 |
-0,338 |
-0,074 |
|
|
IE |
0,069 |
0,091 |
0,138 |
0,14 |
0,132 |
0,145 |
0,152 |
0,159 |
0,124 |
|
|
ROI |
0,012 |
0,014 |
0,022 |
0,032 |
0,018 |
0,019 |
0,019 |
0,022 |
0,015 |
|
|
ROE |
0,024 |
0,03 |
0,048 |
0,078 |
0,051 |
0,046 |
0,05 |
0,058 |
0,04 |
|
|
SLC AGRICOLA |
LI |
0,001 |
0,001 |
0,16 |
0,201 |
0,329 |
0,277 |
0,401 |
0,579 |
0,368 |
|
LC |
1,846 |
1,497 |
1,207 |
1,351 |
1,216 |
1,201 |
1,245 |
1,269 |
1,354 |
|
|
LS |
1,207 |
0,997 |
0,697 |
0,817 |
0,782 |
0,736 |
0,826 |
1 |
1,006 |
|
|
ILNDG |
-0,34 |
-0,526 |
-0,763 |
-0,63 |
-0,676 |
-0,701 |
-0,594 |
-0,386 |
-0,426 |
|
|
IE |
0,081 |
0,077 |
0,114 |
0,11 |
0,121 |
0,138 |
0,137 |
0,089 |
0,108 |
|
|
ROI |
0,003 |
0,019 |
0,045 |
0,01 |
0,023 |
0,016 |
0,023 |
0,003 |
0,07 |
|
|
ROE |
0,005 |
0,031 |
0,083 |
0,019 |
0,045 |
0,029 |
0,051 |
0,006 |
0,137 |
|
|
MINUPAR |
LI |
0,003 |
0,009 |
0,005 |
0,001 |
0,001 |
0,001 |
0,001 |
0,002 |
0,001 |
|
LC |
0,221 |
0,376 |
0,599 |
0,237 |
0,183 |
0,096 |
0,101 |
0,074 |
0,08 |
|
|
LS |
0,19 |
0,291 |
0,409 |
0,188 |
0,151 |
0,083 |
0,084 |
0,058 |
0,064 |
|
|
ILNDG |
0,553 |
1,019 |
10,88 |
0,184 |
0,085 |
0,061 |
0,048 |
0,009 |
0,006 |
|
|
IE |
0,014 |
0,038 |
0,075 |
0,066 |
0,053 |
0,021 |
0,027 |
0,028 |
0,032 |
|
|
ROI |
-0,221 |
-0,147 |
-0,046 |
-0,852 |
-0,267 |
-0,011 |
-0,052 |
-0,064 |
-0,148 |
|
|
ROE |
3,779 |
5,77 |
-0,751 |
1,204 |
0,229 |
0,009 |
0,044 |
0,05 |
0,087 |
|
|
ODERICH |
LI |
0,015 |
0,044 |
0,013 |
0,011 |
0,013 |
0,033 |
0,007 |
0,024 |
0,004 |
|
LC |
1,271 |
1,533 |
1,439 |
1,379 |
1,491 |
1,191 |
1,176 |
1,488 |
1,525 |
|
|
LS |
0,486 |
0,551 |
0,49 |
0,53 |
0,485 |
0,379 |
0,407 |
0,656 |
0,537 |
|
|
ILNDG |
-0,72 |
-0,561 |
-0,594 |
-0,633 |
-0,546 |
-0,795 |
-0,802 |
-0,558 |
-0,548 |
|
|
IE |
0,307 |
0,34 |
0,344 |
0,347 |
0,403 |
0,424 |
0,412 |
0,349 |
0,401 |
|
|
ROI |
0,069 |
-0,015 |
-0,058 |
0,025 |
0,042 |
0,016 |
-0,003 |
0,112 |
0,045 |
|
|
ROE |
0,16 |
-0,039 |
-0,188 |
0,08 |
0,136 |
0,056 |
-0,011 |
0,299 |
0,107 |
Source: Elaborated by author
The indices in table 02 and 03 were evaluated for the same 9-year period and are: Immediate Liquidity, Current Liquidity, Dry Liquidity, General Liquidity, NDG Liquidity Ratio, Inventory Ratio, ROI, ROE.
Table 03: Traditional indexes of companies without a defined typology.
|
indexes |
2009 |
2010 |
2011 |
2012 |
2013 |
2014 |
2015 |
2016 |
2017 |
|
|
EXCELSIOR |
LI |
0,003 |
0,285 |
0,192 |
0,038 |
0,136 |
0,63 |
0,29 |
0,387 |
0,255 |
|
LC |
0,883 |
1,529 |
0,793 |
0,871 |
1,265 |
1,673 |
1,258 |
1,32 |
1,394 |
|
|
LS |
0,643 |
1,218 |
0,648 |
0,679 |
1,063 |
1,365 |
0,967 |
1,043 |
1,185 |
|
|
ILNDG |
-2,777 |
-0,171 |
-1,699 |
-1,519 |
-0,24 |
1,291 |
0,179 |
1,817 |
0,101 |
|
|
IE |
0,057 |
0,056 |
0,055 |
0,051 |
0,037 |
0,049 |
0,056 |
0,064 |
0,045 |
|
|
ROI |
-0,018 |
-0,181 |
0,071 |
0,108 |
0,246 |
0,22 |
0,112 |
0,14 |
0,135 |
|
|
ROE |
-0,064 |
-0,702 |
1,091 |
0,997 |
1,172 |
0,562 |
0,228 |
0,27 |
0,275 |
|
|
M.DIAS BRANCO |
LI |
0,127 |
0,189 |
0,17 |
0,288 |
0,45 |
0,651 |
0,445 |
1,053 |
1,571 |
|
LC |
1,402 |
2,369 |
1,502 |
2,241 |
2,014 |
2,382 |
2,434 |
2,879 |
4,331 |
|
|
LS |
0,822 |
1,442 |
0,949 |
1,35 |
1,302 |
1,707 |
1,571 |
2,154 |
3,233 |
|
|
ILNDG |
-0,577 |
-0,134 |
-0,469 |
-0,177 |
-0,152 |
0,018 |
-0,089 |
0,34 |
0,539 |
|
|
IE |
0,114 |
0,108 |
0,106 |
0,125 |
0,112 |
0,101 |
0,146 |
0,11 |
0,118 |
|
|
ROI |
0,15 |
0,156 |
0,155 |
0,154 |
0,153 |
0,154 |
0,135 |
0,154 |
0,149 |
|
|
ROE |
0,292 |
0,236 |
0,208 |
0,235 |
0,218 |
0,212 |
0,184 |
0,211 |
0,195 |
|
|
MARFRIG |
LI |
0,194 |
0,106 |
0,161 |
0,12 |
0,209 |
0,234 |
0,302 |
0,446 |
0,202 |
|
LC |
1,829 |
1,353 |
1,403 |
1,331 |
2,032 |
1,795 |
1,82 |
1,26 |
1,617 |
|
|
LS |
1,468 |
1,029 |
1,024 |
0,98 |
1,536 |
1,36 |
1,544 |
1,09 |
1,325 |
|
|
ILNDG |
0,78 |
-0,021 |
0,099 |
-0,326 |
0,047 |
0,181 |
0,776 |
0,281 |
0,537 |
|
|
IE |
0,119 |
0,142 |
0,115 |
0,164 |
0,098 |
0,096 |
0,077 |
0,067 |
0,095 |
|
|
ROI |
0,054 |
0,011 |
-0,033 |
-0,01 |
-0,035 |
-0,04 |
-0,027 |
-0,031 |
-0,022 |
|
|
ROE |
0,242 |
0,037 |
-0,186 |
-0,068 |
-0,208 |
-0,231 |
-0,26 |
-0,75 |
-0,404 |
|
|
POMIFRUTAS |
LI |
0,04 |
0,009 |
0,001 |
0,011 |
0,003 |
0,003 |
0,004 |
0,003 |
0,001 |
|
LC |
0,89 |
0,596 |
0,69 |
0,907 |
1,097 |
1,256 |
0,436 |
1,102 |
0,139 |
|
|
LS |
0,476 |
0,276 |
0,358 |
0,513 |
0,777 |
0,859 |
0,227 |
0,617 |
0,049 |
|
|
ILNDG |
-1,28 |
-2,532 |
-1,738 |
-1,143 |
-0,843 |
-0,735 |
-3,241 |
-0,848 |
16,547 |
|
|
IE |
0,391 |
0,276 |
0,352 |
0,367 |
0,279 |
0,246 |
0,404 |
0,217 |
0,122 |
|
|
ROI |
-0,146 |
-0,308 |
-0,107 |
-0,126 |
0,05 |
-0,063 |
-0,235 |
-0,167 |
-0,216 |
|
|
ROE |
-0,301 |
-0,621 |
-0,368 |
-0,492 |
0,278 |
-0,221 |
-0,974 |
0,56 |
0,481 |
|
|
TERRA SANTA |
LI |
1,944 |
0,4 |
0,031 |
0,325 |
0,08 |
0,152 |
0,021 |
0,009 |
0,018 |
|
LC |
4,941 |
1,39 |
0,986 |
1,315 |
1,009 |
0,774 |
0,508 |
0,957 |
0,912 |
|
|
LS |
3,186 |
0,871 |
0,611 |
0,941 |
0,646 |
0,478 |
0,26 |
0,507 |
0,464 |
|
|
ILNDG |
0,64 |
-0,393 |
-1,023 |
-0,571 |
-0,987 |
-1,577 |
-2,494 |
-1,081 |
-1,147 |
|
|
IE |
0,254 |
0,415 |
0,434 |
0,376 |
0,319 |
0,322 |
0,347 |
0,251 |
0,325 |
|
|
ROI |
-0,07 |
-0,044 |
-0,142 |
-0,047 |
-0,085 |
-0,031 |
-0,081 |
-0,064 |
0,003 |
|
|
ROE |
-0,334 |
-0,059 |
-0,273 |
-0,099 |
-0,154 |
-0,059 |
-0,164 |
-0,149 |
0,008 |
Source: Authors.
It is possible to observe tables 02 and 03 the companies results of the traditional indexes which the correlation analysis was performed.
4.3 Correlations study
As noted, only 5 companies could be classified into any of the dynamic model types, so the others did not show any definite trend. Thus, the correlation study continued only with companies defined in specific types, following their respective classifications.
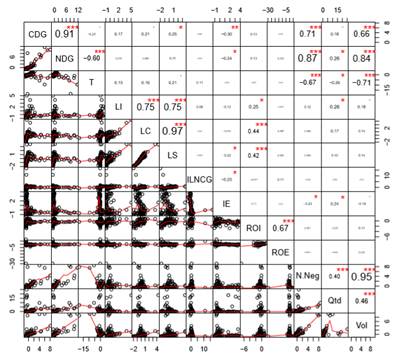
Table 04 presents the correlation results between the indicators of companies classified as solid. It is possible to notice a high correlation between the indicators of the Fleuriet model, which may have been influenced by the fact that they are from the same model and, therefore, have the same business nature. The tables with the results of the companies correlations with their classifications in Fleuriet's dynamic model are presented below:
Table 04: Correlation of companies classified as Type 2 - Solid.
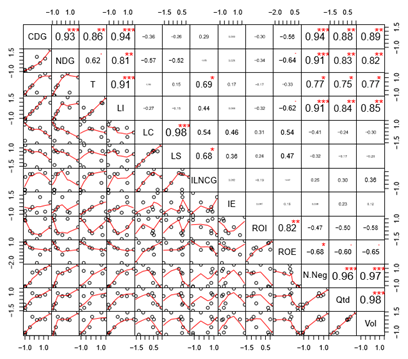
* Significance level (p<0.05)
** Significance level (p<0.01)
*** Significance level (p<0.001)
Source: Elaborated by author.
It is also possible to note that the stock market indicators, N.Neg, Qtd and Vol, have a high correlation with the dynamic model indicators and, in addition, a high correlation with LI and, in this specific case, negative correlation with ROE , but no significant correlation with ROI. In table 05, the correlation between CDG, NDG and T is also positively high with LI, but CDG and NDG have no significant correlation with the other liquidity indicators LC and LS.
Table 05: Correlation of companies classified as Type 3 - Unsatisfactory.
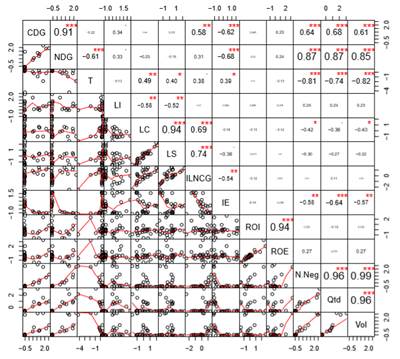
* Significance level (p<0.05)
** Significance level (p<0.01)
*** Significance level (p<0.001)
Source: Elaborated by author.
Regarding the results for companies classified as Type 3, Unsatisfactory, presented in Table 05, a high correlation was observed between CDG and NDG, and the correlation with T was not significant, because T, in this classification, has negative value.
There is a high correlation between the dynamic model indicators and stock market indicators, which is repeated in relation to the classification previously studied.
On the other hand, Table 06 presents the results of companies’ correlations classified as Type 5 – Very Bad. In this case, as in the Unsatisfactory typology, there was a high correlation between CDG and NDG, and the correlation in relation to T was negative, but high. CDG and NDG also had high correlation with the traditional indices LI, LC and LS. The ROI and ROE indicators had no relevant correlation with any of the other indices, as well as the traditional liquidity indicators, which only had a high correlation with each other.
Table 06: Correlation of companies classified as Type 5 - Very Bad.
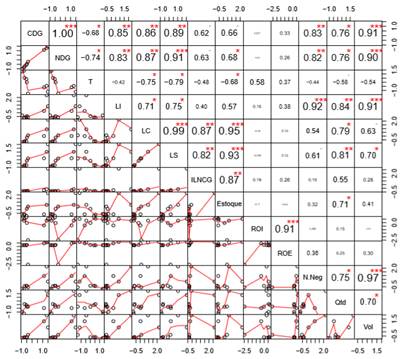
* Significance level (p<0.05)
** Significance level (p<0.01)
*** Significance level (p<0.001)
Source: Elaborated by author.
Stock market indicators generally had a higher correlation with LI, but with a very high correlation with CDG and NDG again. LC and LS also had a good correlation with N.Neg Qtd and Vol. In addition to the correlations analysis of type defined companies, the correlations of companies without a defined pattern were also studied and, finally, an analysis was carried out with all the companies studied, as can be seen in tables 07 and 08 presented above. The LI, LC and LS indices were highly correlated with each other and with ILNDG. ROI and ROE did not obtain relevant correlation indices with any of the other indicators.
Table 07: Correlation of companies classified as “No defined standard”.
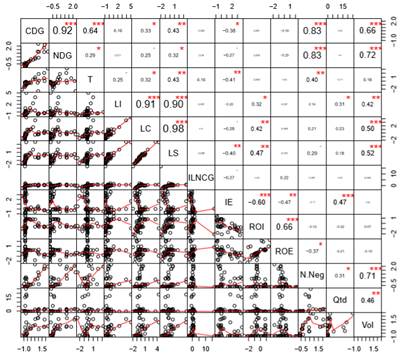
* Significance Level (p<0.05)
** Significance Level (p<0.01)
*** Significance Level (p<0.001)
Source: Elaborated by author
Table 08: Correlation of all companies in the study.
* Significance Level (p<0.05)
** Significance Level (p<0.01)
*** Significance Level (p<0.001)
Source: Elaborated by author.
Through the data, it was observed that the dynamic model indicators had correlation between them, mainly CDG and NDG, with a very high correlation in both groups. Traditional liquidity and stock market indicators were also correlated with each other, as well as ROI and ROE.
Another point to be evaluated is that in the two analysis groups, we see a high correlation between the stock market indicators of the Fleuriet model, mainly N.Neg and Vol, which is not observed in relation to the other indices in general.
5. CONCLUSION
The study of correlations showed that the dynamic model indicators are correlated with both traditional indicators and stock market indicators, but with the exception of a few isolated cases, the ROI and ROE indicators did not have such a high correlation rate with the others. There was a high correlation between the indicators CDG, NDG and T, with positive and negative variations depending on the studied typology.
One of the main findings of this study was to observe that, in general, Fleuriet's dynamic model indicators had the highest correlation results with the chosen stock market indicators, N.Neg Qtd and Vol, having a high correlation in all the analyzed typologies. Thus, the joint analysis of the tools used proved to be effective, and, as proposed, this study contributes with relevant information for possible decision-making, both in relation to the evaluated sector and the stock market.
With the change in the legislation that regulates financial statements, this study was limited to years previous to 2009, so that the information was standardized. A study with a slightly longer period of time would be interesting to better understand the behavior of company indicators. With this universe of companies, it would be worth a survey with other sectors in order to analyze whether the result remains in the same way. It can be noticed that the correlation between the variables does not necessarily indicate causality, that is, it is not possible to state that one variable is directly responsible for the result obtained in others. Therefore, carrying out studies that use complementary statistical tools would be important for a better understanding of the sector scenario.
REFERENCES
Ambrozini, M. A., Matias, A. B., & Júnior, T. P. (2014). Análise dinâmica de capital de giro segundo o modelo Fleuriet: uma classificação das empresas brasileiras de capital aberto no período de 1996 a 2013. Contabilidade Vista & Revista, 25(2), 15-37.
Amorim, D. P. L., Antônio de Camargos, M., & Ferreira Pinto, B. (2021). Análise do capital de giro das empresas listadas na b3 frente à crise econômica brasileira. Revista Evidenciação Contábil & Finanças, 9(3).
Anton, S. G., & Afloarei Nucu, A. E. (2020). The impact of working capital management on firm profitability: Empirical evidence from the Polish listed firms. Journal of risk and financial management, 14(1), 9. https://doi.org/10.3390/jrfm14010009
Assaf Neto, Alexandre. (2002). Administração do capital de giro. 3. Ed. São paulo: atlas.
Avelar, E. A., & Souza, A. A. (2018). Gestão do capital de giro em operadoras de planos de saúde: uma análise sob a perspectiva do modelo dinâmico. ForScience, 6(1). https://doi.org/10.29069/forscience.2018v6n1.e300
Bastos, E. V. P. (2020). Use of fleuriet model for forecasting and evaluating municipal electoral results in a brazilian state. Revista Produção e Desenvolvimento, 6. https://doi.org/10.32358/rpd.2020.v6.484
Bastos, E. V. P., & Mello, J. A. V. B. (2019). Proposta de índice padrão para predição de eficiência e análise de contas públicas municipais. Revista De Globalización, Competitividad Y Gobernabilidad, 13(2), 50-71, 2019. https://doi.org/10.3232/gcg.2019.v13.n2.02
Bastos, E., Bortolon, P., & Maia, V. (2020). Fundamentalist signals in volatility scenarios: evidence in the brazilian stock market. Brazilian Business Review, 17(6), 621-639. https://doi.org/10.15728/bbr.2020.17.6.2
Braga, R. (1989). Fundamentos e técnicas de administração financeira. São paulo: atlas, 1989.
Burritt, R. L., & Christ, K. L. (2021). Full cost accounting: A missing consideration in global tailings dam management. Journal of Cleaner Production, 321, 129016. https://doi.org/10.1016/j.jclepro.2021.129016
Bussab, W.O., & Morettin, P. (2010). Estatística Básica. 6ª. Ed. - São Paulo: Saraiva.
Cavalcanti, J. M. M., & Longhini, T. M. (2016). Modelo dinâmico e modelo tradicional para avaliação do capital de giro: um estudo de caso das empresas do setor de siderurgia listadas na Bm&fBovespa durante o período de 2010 a 2014. Revista de Administração de Roraima-RARR, 6(1), 90-113. https://doi.org/10.18227/2237-8057rarr.v6i1.3185
Chiachio, V. F. D. O., & Martinez, A. L. (2019). Efeitos do Modelo de Fleuriet e Índices de Liquidez na Agressividade Tributária. Revista de Administração Contemporânea, 23, 160-181. https://doi.org/10.1590/1982-7849rac2019180234
Costa, L., Sampaio, J. D. O., & Flores, E. S. (2019). Diversidade de gênero nos conselhos administrativos e sua relação com desempenho e risco financeiro nas empresas familiares. Revista de Administração Contemporânea, 23, 721-738. https://doi.org/10.1590/1982-7849rac2019180327
Couto, V. D., Fabiano, D., & Ribeiro, K. C. D. S. (2012). Gestão Financeira de curto prazo: uma análise do comportamento das empresas do Ibovespa em resposta à crise econômica. Revista de Contabilidade do Mestrado em Ciências Contábeis da UERJ, 16(3), 46-64.
Enqvist, J., Graham, M., & Nikkinen, J. (2014). The impact of working capital management on firm profitability in different business cycles: Evidence from Finland. Research in International Business and finance, 32, 36-49. https://doi.org/10.1016/j.ribaf.2014.03.005
Fleuriet, M., & Zeidan, R. (2015). O Modelo Dinâmico de Gestão Financeira—. Alta Books Editora.
Fleuriet, M., Kehdy, R., & Blanc, G. (2003). O modelo Fleuriet: a dinâmica financeira das empresas brasileiras. Campus.
Freitas, A. L. F., Damasceno, M. A. de A., Souza, C. R., Peixoto, J. K. C., Gonçalo, T. E. E., & Ferreira, E. A. (2022). GIS Multicriteria decision making model for traffic accidents management. Revista Produção e Desenvolvimento, 8(1), e613. https://doi.org/10.32358/rpd.2022.v8.613
Marconi, M. A., & Lakatos, E. M. (2003). Fundamentos de metodologia científica. 5. Ed. São paulo: atlas.
Marques, J. A. V. D. C., & Braga, R. (1995). Análise dinâmica do capital de giro: o modelo Fleuriet. Revista de Administração de Empresas, 35, 49-63. https://doi.org/10.1590/S0034-75901995000300007
Matarazzo, D. C., & Pestana, A. O. (1994). Análise financeira de balanços: abordagem básica e gerencial: livro de exercícios. Atlas, 1994.
Mathiasi Horta, R. A., Santos Alves, F. J., Carvalho, F. A., & Jorge, M. J. (2015). Seleção De Atributos Contábeis Na Previsão De Insolvência De Empresas Brasileiras--Uma Comparação De Abordagens. Base, 12(1). https://doi.org/10.4013/base.2015.121.03
Mellett, S., & O'Brien, E. (2014). Irish SMEs and e‐learning implementation: The strategic innovative approach. British journal of educational technology, 45(6), 1001-1013. https://doi.org/10.1111/bjet.12186
Palombini, N. V. N., & Nakamura, W. T. (2012). Key factors in working capital management in the Brazilian market. Revista de Administração de Empresas, 52, 55-69. https://doi.org/10.1590/S0034-75902012000100005
Rosa, A. A., Forti, C. A., & Dias, V. F. (2022). Impact of internationalization on the working capital requirement of Brazilian companies. RAM. Revista de Administração Mackenzie, 23. https://doi.org/10.1590/1678-6971/eramf220017.en
Silva, D. F. R., & Mello, J. A. V. B. (2021). Aplicando a Análise Relacional Grey a clubes de futebol Brasileiros: uma medição do desempenho financeiro e esportivo. GCG: revista de globalización, competitividad y gobernabilidad, 15(1), 50-70.
Silva, G. R. D., Lopes, J. E. D. G., Pedeneiras, M. M. M., Tavares, M. F. N., & Silva, E. E. D. D. (2016). Um Estudo Sobre O Modelo Fleuriet Aplicado Na Gestão Financeira Em Empresas Do Setor Elétrico Listadas Na Bmfbovespa. REVISTA AMBIENTE CONTÁBIL-Universidade Federal do Rio Grande do Norte-ISSN 2176-9036, 8(2), 92-109. https://doi.org/10.21680/2176-9036.2016v8n2ID8430
Silva, M. L., Santos Cobas, N. L., Matta, I. B., & Juliani, L. I. (2020). Production strategies of a dairy industry in Uruguay. Revista Produção e Desenvolvimento, 6. https://doi.org/10.32358/rpd.2020.v6.439
Silveira, E. D., Zanolla, E., & Machado, L. D. S. (2015). Uma classificação alternativa à atividade econômica das empresas brasileiras baseada na tipologia Fleuriet.
Zanolla, E., & Silva, C. A. T. (2017). O valor da liquidez: um estudo exploratório nas empresas brasileiras do setor de energia elétrica. REAd. Revista Eletrônica de Administração (Porto Alegre), 23, 118-136. https://doi.org/10.1590/1413-2311.041.57359
DECLARATION OF CONTRIBUTIONS TO THE ARTICLE - CRediT
|
ROLE |
Willy |
Edson |
|
Conceptualization – Ideas; formulation or evolution of overarching research goals and aims. |
X |
X |
|
Data curation – Management activities to annotate (produce metadata), scrub data and maintain research data (including software code, where it is necessary for interpreting the data itself) for initial use and later re-use. |
X |
X |
|
Formal analysis – Application of statistical, mathematical, computational, or other formal techniques to analyze or synthesize study data. |
X |
|
|
Funding acquisition - Acquisition of the financial support for the project leading to this publication. |
|
|
|
Investigation – Conducting a research and investigation process, specifically performing the experiments, or data/evidence collection. |
X |
X |
|
Methodology – Development or design of methodology; creation of models. |
X |
X |
|
Project administration – Management and coordination responsibility for the research activity planning and execution. |
X |
|
|
Resources – Provision of study materials, reagents, materials, patients, laboratory samples, animals, instrumentation, computing resources, or other analysis tools. |
X |
|
|
Software – Programming, software development; designing computer programs; implementation of the computer code and supporting algorithms; testing of existing code components. |
X |
|
|
Supervision – Oversight and leadership responsibility for the research activity planning and execution, including mentorship external to the core team. |
|
X |
|
Validation – Verification, whether as a part of the activity or separate, of the overall replication/reproducibility of results/experiments and other research outputs. |
X |
X |
|
Visualization – Preparation, creation and/or presentation of the published work, specifically visualization/data presentation. |
X |
X |
|
Writing – original draft – Preparation, creation and/or presentation of the published work, specifically writing the initial draft (including substantive translation). |
X |
|
|
Writing – review & editing – Preparation, creation and/or presentation of the published work by those from the original research group, specifically critical review, commentary or revision – including pre- or post-publication stages. |
X |
X |