|
Revista Produção e Desenvolvimento Research in Production and Development |
eISSN: 2446-9580 Doi: https://doi.org/10.32358/rpd.2022.v8.589 |
|
Lucila Martinazzo1; https://orcid.org/0000-0002-8991-1382; lucila.martinazzo@mi.unc.edu.ar Claudio Falavigna1; https://orcid.org/0000-0002-9340-0390; cfalavigna@unc.edu.ar 1 Universidad Nacional de Córdoba, Facultad de Ciencias Exactas, Físicas y Naturales, Departamento de Construcciones Civiles, Vélez Sarsfield 1611, Ciudad Universitaria, X5016 CGA Córdoba, Argentina |
Submitted: 20/12/2021. Accepted: 28/01/2022
Published: 02/02/2022
ABSTRACT
Purpose: to evaluate the potential accessibility to public hospitals between 2019 and 2021.
Methodology/Approach: comparative analysis of travel times by public transport, calculated using the r5r package in R with the GTFS provided by the municipality.
Findings: for the three hospital categories evaluated, travel times increased around 20% in the study period, and the most vulnerable quintiles of population increased their travel times 8 points above the less vulnerable quintiles.
Research Limitation/implication: travel times were calculated with programmed schedules and frequencies and fixed values of maximum travel time and maximum walking distance.
Originality/Value of paper: comparative analysis pre-COVID and during COVID of geographical accessibility to healthcare centers. Use of the r5r package that allows changes in the parameters to calculate travel times such as maximum walking distance, maximum travel time, departure time or percentiles.
KEYWORDS: urban mobility, accessibility, public hospitals.
ACCESIBILIDAD A HOSPITALES POR TRANSPORTE PÚBLICO EN LA CIUDAD DE CÓRDOBA: ANÁLISIS COMPARATIVO EN TIEMPOS DE PANDEMIA (2019-2021)
RESUMEN
Propósito: evaluar la accesibilidad potencial a hospitales públicos entre 2019 y 2021.
Metodología: análisis comparativo de tiempos de viaje en transporte público, que fueron calculados usando el paquete r5r en R con los GTFS publicados por el municipio.
Resultados: para las tres categorías de hospitales evaluadas los tiempos de viaje se incrementaron alrededor del 20% en el período de estudio, y los quintiles más vulnerables de la población incrementaron sus tiempos de viaje 8 puntos porcentuales por encima de los quintiles menos vulnerables.
Limitaciones: los tiempos de viaje fueron calculados con cronogramas y frecuencias programadas, y un máximo tiempo de viaje y máxima distancia de caminata fijadas.
Originalidad: análisis comparativo pre pandemia y durante la pandemia de accesibilidad geográfica a centros de salud. Uso del paquete r5r que permite cambios en los parámetros de cálculo de los tiempos de viaje, como la distancia máxima de caminata, tiempo de viaje máximo, horario de salida o percentiles.
PALABRAS CLAVE: movilidad urbana, accesibilidad, hospitales públicos.
1. INTRODUCTION
The access to healthcare services and its relationship with the accessibility provided by the transport system available is widely studied. The geographical accessibility is one of the many components of an adequate access to healthcare (Neutens, 2015; Penchansky & Thomas, 1981). Several studies proved that in locations with low accessibility, the health services provided were deficient (Ghorbanzadeh et al., 2020; Shah et al., 2016; Wan et al., 2013; Hiscock et al., 2008). Others present the relationship between scarce infrastructure and different levels of accessibility (Chen et al., 2021; Agbenyo et al., 2017; Gage & Calixte, 2006) or the general inequalities among the population in their access to healthcare centers taking into account their social and economic characteristics (Kim et al., 2021; Li et al., 2021; Pereira et al., 2021b; Wang et al., 2020; Shah et al., 2016; Wan et al., 2013; Dai, 2010).
Argentina has a complex public healthcare system with municipal, provincial and national facilities of different levels all over the country. Public healthcare centers are a reference for the local population; many people rely on public services to access to vaccination schemes, to monitor chronic diseases or even for surgical interventions.
In the second semester of 2020, 35.9% of the population of the 31 most important cities of Argentina relied on public services to get access to healthcare, equivalent to 10,249,000 inhabitants, according to the Instituto Nacional de Estadística y Censos (INDEC), the governmental institution in charge of national statistics. Regarding the type of medical coverage, 39.4% of households used the public system, and 18.3% of households exclusively relied on public healthcare coverage because none of their members had another type of assistance (INDEC, 2021).
Due to the global outbreak of SARS CoV-2, national governments declared a sanitary emergency and took measures to limit the spread of the virus. Lockdowns and social distancing measures impacted on the countries’ economies, particularly in Argentina where the GDP dropped 9.9% in 2020. Additionally, Argentina is facing an inflationary spiral that reached a 36% annual rate in 2020, and had critical socio economic indicators with 42.9% of poverty rate and 10.5% of indigency rate (Banco Mundial, 2021).
Urban mobility was reduced over lockdown periods and that situation jeopardized the financial sustainability of public transport systems. In Argentina, the use of public transport was restricted in terms of the occupancy of the vehicles and the people allowed to take public transport; for instance, in some periods of strict lockdown when only health or security workers had circulation permits. In this context, travel demand by buses or trolleys slumped in Córdoba, severely affecting operators’ income. To keep the system working with fewer resources, the city council had to reduce the frequencies of services and the length of routes.
The main objective of this research was to compare geographical accessibility to public hospitals between 2019 and 2021, as well as to evaluate if the changes introduced in the public transport system during the pandemic in the city of Córdoba impacted on the access to healthcare services by means of public transport. For that purpose, the importance of previous studies that evaluated the relationship between public transport services and healthcare services is highlighted in the literature review of the following section, as well as research that studied several forms of addressing travel times estimations. A methodology based on travel times by buses or trolleys calculated from programmed open access schedules is suggested in Section 3. The main results are presented through statistical analysis in Section 4. The results scope, limitations and the conclusions from the results and methodology are presented in the final section.
2. LITERATURE REVIEW
2.1. Accessibility to healthcare facilities.
The access to healthcare services has multiple dimensions (Neutens, 2015; Penchansky & Thomas, 1981), namely: i) affordability, meaning the cost of the service; ii) acceptability, including health service compliance and satisfaction; iii) availability of the required service; iv) geographic accessibility, defined as the ease of accessing to the different health centers that potential patients have related to travel times and costs; and v) accommodation, i.e. attention times and quality of the service. This research inquiries about geographic accessibility defined in terms of travel times by public transport to access healthcare centers.
There is evidence from the literature that shows the importance of geographical accessibility to healthcare services since populations living in those neighborhoods or zones with low access have worse health conditions (see e.g. Gage & Calixte, 2006; Hiscock et al., 2008; Dai, 2010; Wan et al., 2013; Shah et al., 2016). Several research has measured different levels of inequality regarding geographical accessibility to healthcare between different neighborhoods and zones of a city; one of the main aims that these studies follow is to identify critical zones with low access (see e.g. Shah et al., 2016; Agbenyo et al., 2017; Ghorbanzadeh et al., 2020; Li et al., 2021; Chen et al., 2021). At present, where the world is threatened because of the pandemic caused by SARS-CoV 2 (COVID-19), the accessibility analysis contributes to understanding how to better allocate health care resources and to identify those areas with major needs (see e.g. Chen et al., 2021; Kim et al., 2021; Li et al., 2021; Pereira et al., 2021b). The Table 1 resumes main studies.
Table 1: Studies relating geographic accessibility and health conditions.
|
Author, year. |
Location and objectives |
Main results |
|
Chen et al., 2021 |
Studies accessibility to health care services for older bus passengers in Nanjing, China, using the Gaussian two-step floating catchment area (2SFCA) and the adjusted 2SFCA methods. |
The stations with the lowest levels of accessibility were mainly distributed in peripheral areas of the city, medium accessibility was measured in the central areas with more developed bus stations and healthcare centers, and stations with high accessibility scores were mainly found in peripheral areas where provider-to-population ratio (PPR) was high. |
|
Kim et al., 2021 |
Authors examined the temporal variations in the spatial accessibility of the COVID-19 patients to medical facilities in the State of Florida through a three-step floating catchment area method, spatial statistics, and logistic regression. |
Main findings indicate that North Florida, rural areas, and zip codes with more Latino or Hispanic populations were more likely to have lower access than other regions during the COVID-19 pandemic. |
|
Li et al., 2021 |
This paper assesses cumulative opportunity equity among older adults to senior centers in Philadelphia, Pennsylvania. They use GTFS data and Census tract information. |
Authors state some inequalities: i) accessibility in suburban neighborhoods is generally lower than in city centers; ii) accessibility to senior centers is generally lower in the middle of the day than during peak commuting hours; iii) equity measure is sensitive to definitions of shares and subgroup shares. |
|
Pereira et al., 2021b |
Studies the accessibility to COVID-19 healthcare services in the 20 largest cities of Brazil. |
The results identify great social and spatial inequities in access to health services during the pandemic. |
|
Table 1 (continuation): Studies relating geographic accessibility and health conditions. |
||
|
Author, year. |
Location and objectives |
Main results |
|
Ghorbanzadeh et al., 2020 |
Authors estimate free flow travel time based on accessibility measures to mental health facilities for different age groups in the State of Florida (USA). |
The results showed that those counties with lower accessibility to mental health facilities are mostly located in rural areas and mainly clustered in Northwest Florida. |
|
Wang et al., 2020 |
In order to determine accessibility to hospitals by taxi in Beijing, authors proposed an “observed hospital accessibility” (OHA) measure to be compared with the potential hospital accessibility, calculating a two-step floating catchment area (2SFCA) for each method. OHA measures were computed from the Taxi trip GPS database. |
On average, potential accessibility was higher than the observed accessibility, and almost reached governmental goals. However, the coefficient of variation showed that the distribution was uneven in the space in both cases and the OHA showed larger spatial differences. For the potential accessibility, grid units with the highest levels of accessibility were mainly located in the fourth ring road where low temporal and spatial impedance prevailed, whereas the distribution of OHA had a polycentric structure. |
|
Agbenyo et al., 2017 |
Studies household accessibility to community based health services, district based health services and hospitals in rural Ghana. |
Two levels of accessibility were identified. First, appropriate access level to community based health services was found because of their widespread distribution. The access to hospitals was very poor, with only 4% of the communities having proper access to this kind of facility. Authors identify deficient road conditions as an important factor. |
|
Shah et al., 2016 |
Estimates spatial accessibility to primary healthcare centers using the Three-Step Floating Catchment Area (3SFCA) method in fourteen Canadian cities. |
The results show that those neighborhoods with poor accessibility had further disadvantages in relation to high healthcare needs. For instance, results showed that for those neighborhoods with poor accessibility there were 50.5% of the population without high school education and also that 48.7% of the households were of lone-parents. |
|
Wan et al., 2013 |
Studies the disparities in access to early diagnosis of Colorectal Cancer patients in the state of Texas, USA. |
Those patients located in areas of low accessibility showed higher rates of late diagnosis. Ethnic and socioeconomic inequalities were also found. |
|
Dai, 2010 |
Studies the spatial and racial inequalities in the early diagnosis of Breast Cancer in the Metropolitan area of Detroit, Michigan, USA. |
The results show a correlation between the difficulty to access to diagnostic centers equipped with mammographer and the probability of having a late diagnosis. It also shows ethnic inequalities. |
|
Hiscock et al., 2008 |
Study conducted nationwide in New Zealand. Travel times to health centers and pharmacies were estimated using the road network and without specifying the mode of transport used. |
The research shows that those areas with excessive travel time had fewer visits to health centers and pharmacies, especially in rural areas. |
|
Gage & Calixte, 2006 |
Study the geographic accessibility to maternal healthcare services in Haiti. |
The results show that in those areas with low transport infrastructure, pregnant women made fewer consultations during pregnancy. |
Source: Created by the author
2.2. Calculation of access time by public transport.
Travel time estimations from a departure location to a destination, usually called door-to-door travel times, are made through routing algorithms. Generally, these types of tools use street network layers and information regarding the composition of the transport system.
In the particular case of public transport, door-to-door travel time estimations are a challenge because of the multiple steps that can integrate a full trip. For instance, the walking segments between the starting or arrival point to the boardings or descents at stopping points, the possible need for transfers and the services with variable schedules and frequencies throughout the day. Besides, multiple itineraries may exist to link an origin and a destination. Thereby, accessibility by public transport varies depending on when the trip begins and the decisions made by the traveler, particularly in services with low frequency (Owen & Levinson, 2015).
Public transport accessibility studies were traditionally based on average values over peak hours, such as travel speed or programmed frequencies (Wu & Hine, 2003; Polzin et al., 2002). Another usual approach was the usage of average values from surveys or census data from the users (Kawabata 2003, 2009; Kawabata & Shen 2006, 2007).
More recently, new information sources with details about public transport schedules have emerged. That is the case of the General Transit Feed Specification (GTFS) and the computational routing algorithms that enhance travel time estimations. The main aspects present are the inclusion of: i) variations in departure times, ii) door-to-door travel times distribution, and iii) selection of alternative itineraries beyond the shortest route.
The possible variations on departure times are a fundamental aspect since the transport system availability is not uniform throughout the day. To solve this issue, some studies define a time window and compute average accessibility values for trips with different start time within the time window (Farber & Fu, 2017; Owen & Levinson, 2014). Other types of research use the concept of continuous accessibility, that is calculated continuously in a time window rather than at a single or a few departure times (Owen & Levinson, 2015). Therefore, the results from these methodologies are a series of travel time values that have a particular distribution over the evaluated time window. This distribution allows the usage of travel times different from the mean, and even higher percentiles.
Another important aspect is the itinerary selection. As the detailed schedules for public transport are available, the routing algorithms can select the line that will pass first and make the most efficient combinations for each trip according to the departure time (Conway et al., 2017, 2018; Delling et al., 2015).
3. METHODOLOGY
To assess the research aim to evaluate potential accessibility to public hospitals pre-Covid and during Covid, travel time by public transport was calculated using the r5r package in R, developed by Pereira et al. (2021a). The schedules and frequencies were obtained in GTFS format from the municipality open data webpage, and further information about the main characteristics of the system were found in the details published by the companies that own the concession of the service. For 2019 the GTFS feed had a frequency based format because it included a table with the programmed frequencies in minutes, whereas the 2020 GTFS was scheduled based. This information is presented in Section 3.2.
In order to organize inhabitants in the territory the zonification from the 2010 population census was considered. Additionally, the percentage of households with unsatisfied basic needs (%NBI, porcentaje de hogares con Necesidades Básicas Insatisfechas) was the indicator used to classify the inhabitants in quintiles in relation to their socioeconomic status. All population data regarding their social and economic characteristics were obtained from the INDEC’s 2010 census database, while public hospital information came from IDERA (Infraestructura de Datos Espaciales de la República Argentina). The main demographic characteristics are developed in the following section, and all databases are described in Section 3.3.
3.1. Demographic, social and economic characteristics in the study area.
Cordoba is the capital city of the Province of Córdoba, in the central region of Argentina, and forms the Capital Department with a territory of 573.2 km2. According to the 2010 census, which divided the area in 1,503 zones, Municipalidad de Cordoba (Cordoba’s town hall) had 1,329,604 inhabitants and 414,237 households (INDEC, 2015).
The percentage of households with unsatisfied basic needs (%NBI) is an indicator of socioeconomic status and structural poverty that considers other elements beyond income. In Córdoba, 5.82% of the households showed at least one of the indicators included in the %NBI measure in 2010. To be considered as a household with unsatisfied basic needs, at least one of the following deprivation conditions must be present: households inhabiting dwellings with more than 3 people per room (critical overcrowding), households inhabiting dwellings of an inconvenient type such as tenancy rooms or precarious dwellings, households inhabiting dwellings without flushing toilets, households with school-age children not attending school, a four (or more) member family group where only one of them is working and where the head of household attended 2 or less than 2 years to primary school (INDEC, 2000). The main deprivation conditions in Córdoba are overcrowding (3%), sanitary conditions (1.2%) and type of dwelling (1.1%) (Dirección General de Estadística y Censos de la Provincia de Córdoba, 2021).
During the 2010 population census a broader survey was conducted to a sample of households to deepen the knowledge about dwelling conditions, migration, healthcare services, social security and employment. At the departmental level, Córdoba had 32.4% of their population depending exclusively on the public healthcare system, that includes state plans and people without any other type of assistance. Nearly 70% of people in this situation belong to the age group between 15 and 64 years old.
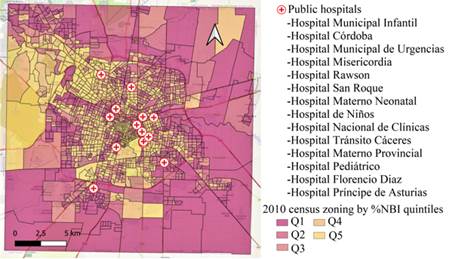
Figure 1: Population census zonification by %NBI quintiles and public hospitals in Córdoba
Source: Created by the author
The public healthcare system in Córdoba has municipal, provincial and national institutions. According to the IDERA’s database (2020) used in this research, provided by the Argentine Integrated Health Information System (SISA, Sistema Integrado de Información Sanitaria Argentino), the healthcare centers can be divided into three categories: high-risk healthcare centers with specialized intensive therapy (CAT I), high-risk healthcare centers with intensive therapy (CAT II), and low-risk healthcare centers with simple hospitalization (CAT III). Beside these main establishments, around a hundred primary health care municipal centers are distributed in the city in different neighborhoods.
Figure 1 illustrates the 2010 population census, 1,503 zones categorized by percentage of households with unsatisfied basic needs (%NBI) quintiles. The first quintile Q1 corresponds to the most vulnerable households, with the highest percentage of households with NBI, and the last quintile Q5 corresponds to the less vulnerable households, with the lowest percentage of households with NBI. The picture also shows the 14 hospitals from IDERA’s database and their names.
3.2. Transport system and mobility characteristic in the study area
The public transport system in Córdoba includes bus lines and trolley lines, table 2. In 2019, three companies owned the concession of the 69 bus lines: Autobuses Córdoba (5/69), Coniferal (21/69) and ERSA (43/69). The trolley service was provided by the municipal company Tamse, and consisted of three lines completely supplied by electric energy. During 2021 first semester, the concession contract was still in force, but because of the decrease in the demand explained in the Introduction Section some bus lines stopped operating, and the distribution among the concession companies changed: Autobuses Córdoba (5/60), Coniferal (21/60) and ERSA (34/60). The trolley service provided by Tamse doubled the number of lines, but the power supply changed to a mixed scheme with a part of the fleet using diesel engines.
Table 2: 2019-2021 public transport system characteristics in Córdoba
|
|
2019 |
2021 |
|
Total extension (km) |
3,896 |
2,860 |
|
Stops |
5,876 |
4,961 |
|
Programmed mean frequency (veh/h) |
3.82 |
S/D |
|
Average demand |
447,693 |
218,358* |
|
Average daily kilometers traveled |
154,344 |
106,901* |
|
Lines |
72 |
66 |
|
Core lines |
59 |
55 |
|
Ring lines |
2 |
2 |
|
Neighborhood lines |
7 |
2 |
|
Trolley |
3 |
6 |
|
Special |
1 |
1 |
|
*Partial data up to April 2021 |
|
|
Source: Created by the author with information from Municipalidad de Córdoba
The main characteristics of the public transport system in Córdoba in 2019 and 2021 are summarized in Table 2. The passengers demand and the daily kilometers traveled in 2021 are up to April, and there was no data available about frequencies programmed or measured for the same period.
3.3. Materials and methods
To reach the objectives proposed in this research, open data sources were used. The public transport system was described through a General Transit Feed Specification (GTFS), published by Municipalidad de Cordoba during 2019 and 2021 in their open data webpage. The centroids of 1,503 zones from the 2010 population census by INDEC were used as origins of the trips, and the 14 hospitals from the IDERA’s open database were used as destinations of the trips.
During 2019, Municipalidad de Córdoba released the first GTFS static, and it was available online in the open government webpage. This feed was a frequency based GTFS, as it provides a table with the programmed frequencies in minutes. In April 2021, it published a new GTFS with a scheduled based format in the same webpage, and the previous one was deleted. The difference between this kind of feeds is that fixed schedules are followed for trips in the schedule-based type, whereas in the frequency based GTFS routes are specified using fixed headways according to the information provided by the frequency table.
A shapefile with 1,503 zones in the Capital Department was obtained from the 2010 INDEC’s population census. Through QGIS the centroids of the polygons were obtained and used as origins for the modeled trips. The destinations selected were 14 public hospitals from IDERA’s database, which were grouped following the categories available in the database explained in Section 3.1. Five hospitals belonged to CAT I, five hospitals to CAT II and four hospitals to CAT III. This categorization was used for grouping the results obtained according to different levels of attention and services provided. Hospital Neuropsiquiatrico, the mental health hospital of the city, was excluded from this analysis because the type of attention provided there is different from that of the rest of the hospitals. The information was obtained in a .kml format.
As it was noted in Section 2.2., door to door travel time estimations are important indicators of accessibility by public transport. In this research, the r5r package in R (Pereira et al., 2021a) was the tool used to obtain travel times between origins (census zones) and destinations (public hospitals). The function travel_time_matrix in r5r provides travel times between a pair or multiple pairs of origins and destinations. This package uses a specific extension of the routing algorithm RAPTOR that computes all Pareto-optimal journeys between each origin destination pairs minimizing the arrival time and the number of transfers made between them (Delling et al., 2015). The calculation is made by the schedules provided in the GTFS; if the GTFS is frequency based the schedules are modeled with a departure per minute during a time window. In both cases a set of optimal paths are obtained in each round of the algorithm, but in the frequency based GTFS, the schedules are randomly generated (Conway et al., 2017).
r5r uses a street network in .pbf format and one or several transport networks in GTFS.zip format to build a multimodal transport network. In this research, a street network from OpenStreetMaps obtained from Protomaps in .pbf format was used. To calculate travel times, origins and destinations must be loaded as points; in this case the centroids of the 2010 census and public hospitals respectively.
 |
The travel_time_matrix function shows arguments that can be set by the user: modes, time of departure, time window, percentile of travel times displayed, maximum walking or biking distance, maximum trip duration, average walking or biking speed, among others. In this research, a time window between 9 and 11 in the morning was analyzed, and the departure date was set on an April’s Wednesday in 2019 and 2021. A maximum walking distance of 833 meters-equivalent to a 10 minutes’ walk-was used, and a maximum 120-minute trip duration was set.
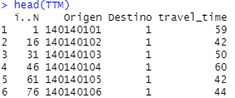
Figure 2: Travel time result from R
Source: Created by the author
Figure 2 shows part of the data frame obtained in R, where the travel times displayed correspond to 85 percentile, meaning 85% of trips between every origin destination pair are shorter than the obtained result. With the travel times obtained, an average per hospital category per zone was calculated. In the data frame that resulted from this grouping, where each row corresponds to an only zone identified by its code, the number of total households and the number of households with NBI was added. The percentage of households with NBI (%NBI) was calculated and used to classify the households into quintiles.
The final result consisted in three data frames, one for every hospital category (CAT I, CAT II, CAT III), with a single travel time value for each zone. Weighted quintiles per number of households were calculated, so that the zones were classified into groups accounting for 20% of households each.
4. RESULTS
In the data frames obtained as a result of the methodology described in the previous section, two types of weighted quintiles were considered. First, average travel times for the three hospital categories were graphed as probability curves by quintiles in proportion to the percentage of households with unsatisfied basic needs (%NBI), as illustrated in Figure 3. The first quintile Q1 corresponds to the most vulnerable zones that had the highest proportion of households with deprivation conditions, whereas Q5 groups the least deprived households.
Overall, the 2021 density curves are displaced to the right compared to the 2019 curves, indicating higher median and mean travel times in 2021, as illustrated in Figure 4. Additionally, 2021 curves are more spread than 2019 curves, showing a higher dispersion of the values.
If the comparison is made among quintiles, it is observed that for both years the most vulnerable quintiles, the first ones, concentrate the distribution on higher average travel time values than the last quintiles. For both 2019 and 2021, the fifth quintile shows a bimodal distribution. The two peaks in the curves may show the difference between high income neighborhoods near the city center with lower travel times, and high-income neighborhoods in closed residential areas in the periphery of the city.
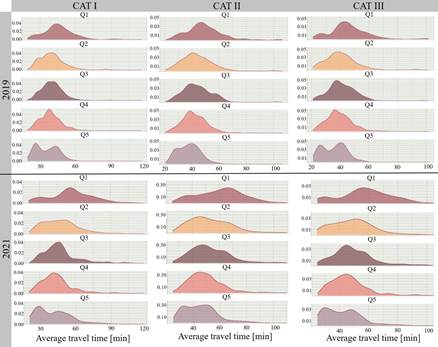
Figure 3: Average travel time density curves per quintile %NBI
Source: created by the author
The tendencies observed in the density curves are reflected in the box plots in Figure 4. The gap between the minimum and the maximum value is greater for the 2021 box plots for CAT I, CAT II and CAT III, and in general the median value is also higher for 2021 than for 2019. For 2021, more outliers are observed and the interquartile range is wider, consistent with the spread highlighted in the density curves.
The differences between the first and last quintiles commented in Figure 3 are also observed in Figure 4. The results show a clear gap between Q1 and Q5, where Q1 has higher medians for the three hospital categories, meaning that, on average, the group of most vulnerable households has higher travel times than the less vulnerable groups such as Q4 and Q5.
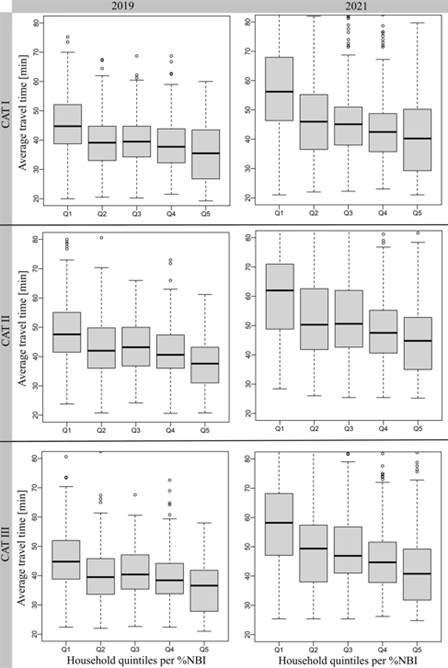
Figure 4: Average travel times box plots per %NBI quintiles
Source: Created by the author
The mean, median and standard deviation for the three hospital categories are summarized in Table 3, where the values are presented in total and grouped by household quintiles per %NBI for the two analyzed years. As an overall trend, 2021 travel times are higher than 2019 values. In CAT I, CAT II and CAT III travel times increased 18.11%, 21.01% and 20.56% respectively.
The differences in travel times between 2019 and 2021 are generally greater for the most vulnerable quintiles: the gap between Q1 and Q5 reaches almost 8% for CAT I and CAT III, and almost above 3% for CAT II. In all categories the mean and median values are higher for the first quintiles than for the last quintiles.
Table 3: Descriptive statistics per hospital category per %NBI household quintiles
|
|
|
2019 |
2021 |
||||
|
|
|
Mean |
Median |
SD |
Mean |
Median |
SD |
|
CAT I |
Q1 |
45.50 |
44.80 |
13.40 |
56.20 |
56.20 |
17.20 |
|
Q2 |
39.70 |
39.10 |
10.30 |
47.50 |
46.00 |
15.50 |
|
|
Q3 |
39.80 |
39.50 |
8.74 |
46.90 |
45.10 |
14.50 |
|
|
Q4 |
38.50 |
37.80 |
8.57 |
44.10 |
42.50 |
13.20 |
|
|
Q5 |
35.50 |
35.50 |
9.24 |
40.80 |
40.20 |
13.70 |
|
|
Total |
39.62 |
39.25 |
10.62 |
46.80 |
45.25 |
15.64 |
|
|
CAT II |
Q1 |
48.80 |
47.60 |
13.20 |
60.60 |
62.00 |
16.40 |
|
Q2 |
43.40 |
42.00 |
11.20 |
52.50 |
50.30 |
14.80 |
|
|
Q3 |
43.60 |
43.20 |
10.10 |
52.60 |
50.60 |
14.10 |
|
|
Q4 |
41.50 |
40.60 |
9.10 |
49.20 |
47.50 |
12.60 |
|
|
Q5 |
37.50 |
37.60 |
8.03 |
45.40 |
44.80 |
12.40 |
|
|
Total |
42.77 |
41.80 |
11.00 |
51.75 |
49.80 |
14.87 |
|
|
CAT III |
Q1 |
45.70 |
44.80 |
12.80 |
57.50 |
58.20 |
16.60 |
|
Q2 |
40.30 |
39.50 |
10.50 |
49.20 |
49.40 |
14.60 |
|
|
Q3 |
41.10 |
40.40 |
9.20 |
49.20 |
46.90 |
13.50 |
|
|
Q4 |
39.20 |
38.40 |
8.51 |
45.90 |
44.70 |
12.30 |
|
|
Q5 |
35.60 |
36.60 |
8.31 |
42.10 |
40.80 |
12.40 |
|
|
Total |
40.21 |
39.60 |
10.43 |
48.48 |
47.00 |
14.74 |
|
Source: Created by the author
The results obtained were also plotted geographically in quintiles per average travel time, as can be seen in figure 5. For 2019, travel time values were obtained in 1,449 zones over a total of 1,503 for CAT I, whereas for CAT II and CAT III the number of zones with travel time values was 1,448. For 2021, 1,447 zones with results from the application of the methodology were obtained in the three categories.
The zones in gray observed in figure 5 have no travel time data because of the parameters set in r5r explained in Section 3.3.; that is to say that the maximum travel time is higher than two hours or the nearest stop is further than a 10-minute walk. These zones are also in the periphery of the city and the areas are greater than other zones near to the city center. This situation could influence the final result because centroids were used as origins of the trips. Overall, among all the categories and in both years studied, zones with no data are coincident.
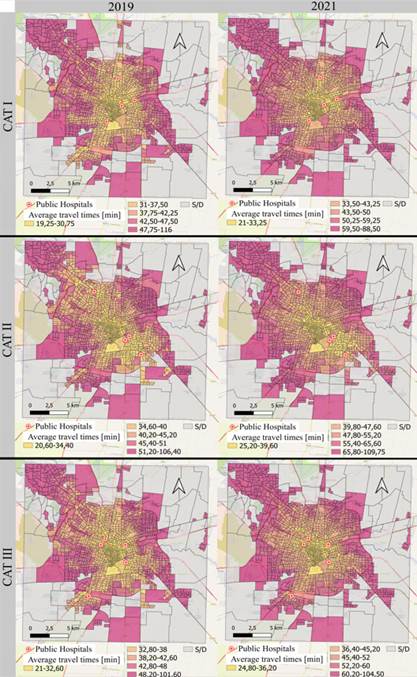
Figure 5: Spatial distribution of travel times
Source: Created by the author
In figure 5 it can be seen that for 2019 there are more zones with lower travel times, painted in yellow tones, than in 2021 where violet tones domain. This trend is observed for the three hospital categories.
5. CONCLUSIONS
The conclusions were drawn from two aspects: the results measured in the current socioeconomic and sanitary context in Argentina, and the application of the proposed methodology.
5.1 Conclusions about the actual situation and results obtained.
The results obtained in this research must be analyzed within the current circumstances. First, Argentina faces an inflationary context that impacts not only on the price structure but also on the purchasing power. The general social and economic situation shows high levels of unemployment and poverty. Considering this background, the SARS CoV-2 pandemic and the changes it brought to society and to people’s lifestyle impacted severely on the country's economy in general, and particularly in the financial sustainability of public transport.
In Córdoba, the public transport system is financed by the users' tickets and municipal, provincial and national subsidies. Due to the complex circumstances previously exposed, and the consequent drop in income because of the decrease of travel demand and other forms of external financing, during periods of lockdown the municipality and the concession companies had to introduce modifications in the routes and frequencies of public transport. These changes sought to reduce the number of kilometers traveled by keeping the passenger kilometer index as high as possible in order to achieve a minimal financial sustainability of the system.
During 2021, the release of restrictions and the opening of new activities induced a recovery of the demand for public transport; therefore, there was an increase of the financial support to the concession companies, together with some modifications to improve the quality of service. For instance, the municipal company Tamse increased its participation in the public transport system and new buses were bought; however, these actions are not yet enough to respond to users' demands.
Considering the aforementioned general context, this research quantified the impact of potential accessibility to public healthcare through public transport in Córdoba. This analysis was made comparing travel times, taking into account the public transport system in 2019 before the pandemic and the service offered during the pandemic in 2021.
Overall, the results showed that travel times to public hospitals increased by 20% in the three hospital categories studied during the 2019-2021 period. From the evaluation presented in Section 4, the differences in travel times among quintiles in proportion to the percentage of households with unsatisfied basic needs (%NBI) were highlighted. The increments in travel times had an 8 points gap between Q1, where the most vulnerable households were, and Q5 for the first category, and almost the same value for CAT III, whereas the gap between the extreme quintiles for CAT II was just over 3%. The relative and total differences in travel times for 2019 and 2021 among least and most vulnerable groups show a greater detriment in potential accessibility for more deprived households, which illustrates part of the inequity they are subjected to.
Although it was to be expected that the modifications after 2019 in the public transport system would produce an increase in travel times, the fact that the greatest impact was felt by the most vulnerable households was an additional effect that indicates that issues of equity and social justice have not been considered in the planning of these changes.
The results obtained in this research are not determinant because the analysis is limited to the parameters and data considered to calculate travel times. Nevertheless, in a decision-making process, accessibility indicators should always be considered so as not to harm the underprivileged households. The aim of this study is to highlight the differences in the impact of the measures taken by the municipality, and to promote modifications to the public transport system that benefit the most vulnerable households to a greater extent.
5.2 Conclusions about the methodology.
The proposed methodology and the use of open data sources in this research provide a replicable simple process. The information provided in GTFS format and packages as r5r to assess rapid realistic routing and calculate travel times between multiple origins and destinations constitutes an opportunity to model different, changing scenarios.
The parameters set in r5r to calculate travel times in this study (Section 3.3) meant to reflect the quality standards that the public transport service in Córdoba should have, and responds to previous research made about the conditions of access to buses and trolleys stops in the city.
As the origins set were the centroids of the census zones, the maximum walking distance may be seen as a restriction. This is because zones in the periphery of the city had greater areas to respect their homogeneity characteristic, the centroid may not be representative of the real distance to access stops. Coincidentally, most of these areas also had a high percentage of households with NBI. On top of that, the maximum travel time may limit the result obtained in the same way.
Another parameter that may limit the extent of this research is the fact that an only time window in an only day was used for the analysis, although the day and time selected might be representative of an average week day. Furthermore, as the GTFS provided are static, meaning that they consider programmed time tables, the results are static as well and may not represent the variety of real situations users could experience in accessing healthcare services through public transport.
The conclusions reached would lead to further research to correct travel times according to real time tables and to include a set of parameters to get travel time values for zones in the periphery. Additionally, complementary indicators would be obtained to characterize mobility and accessibility in Córdoba in full extent, so as to identify the particularities of households and individuals in their diversity.
6. ACKNOWLEDGEMENTS
This research is part of the activities of a master 's scholarship awarded to Lucila Martinazzo by the Science and Technology Secretary (Secretaría de Ciencia y Tecnología - SeCyT) from Universidad Nacional de Córdoba. Additionally, the research is part of 2018-2021 Proyecto Consolidar, “Movilidad Urbana Inclusiva” (Inclusive Urban Mobility, grant numbers 33620180100043CB). A first version in Spanish of this research was presented at the 35° ANPET conference.
7. REFERENCES
Agbenyo, F., Marshall Nunbogu, A., & Dongzagla, A. (2017). Accessibility mapping of health facilities in rural Ghana. Journal of Transport & Health, 6, 73–83. https://doi.org/10.1016/j.jth.2017.04.010
Banco Mundial (2021) Argentina: panorama general. https://www.bancomundial.org/es/country/argentina/overview
Chen, W., Cheng, L., Chen, X., Chen, J., & Cao, M. (2021). Measuring accessibility to health care services for older bus passengers: A finer spatial resolution. Journal of Transport Geography, 93, 103068. https://doi.org/10.1016/j.jtrangeo.2021.103068
Conway, M. W., Byrd, A., y Eggermond, M. van. (2018). Accounting for uncertainty and variation in accessibility metrics for public transport sketch planning. Journal of Transport and Land Use, 11(1), Article 1. https://doi.org/10.5198/jtlu.2018.1074
Conway, M. W., Byrd, A., y Van Ver Linden, M. (2017). Evidence-Based Transit and Land Use Sketch Planning Using Interactive Accessibility Methods on Combined Schedule and Headway-Based Networks. Transportation Research Record, 2653(1), 45-53. https://doi.org/10.3141/2653-06
Dai, D. (2010). Black residential segregation, disparities in spatial access to health care facilities, and late-stage breast cancer diagnosis in metropolitan Detroit. Health & Place, 16(5), 1038-1052. https://doi.org/10.1016/j.healthplace.2010.06.012
Delling, D., Pajor, T., y Werneck, R. F. (2015). Round-Based Public Transit Routing. Transportation Science, 49(3), 591-604. https://doi.org/10.1287/trsc.2014.0534
Dirección General de Estadística y Censos de la Provincia de Córdoba (2021) Conocé Córdoba. https://estadistica.cba.gov.ar/conoce-cordoba/
Farber, S., y Fu, L. (2017). Dynamic public transit accessibility using travel time cubes: Comparing the effects of infrastructure (dis)investments over time. Computers, Environment and Urban Systems, 62, 30-40. https://doi.org/10.1016/j.compenvurbsys.2016.10.005
Gage, A. J., y Calixte, M. (2006). Effects of the physical accessibility of maternal health services on their use in rural Haiti. Population Studies, 60(3), 271-288. https://doi.org/10.1080/00324720600895934
Ghorbanzadeh, M., Kim, K., Ozguven, E. E., & Horner, M. W. (2020). A comparative analysis of transportation-based accessibility to mental health services. Transportation Research Part D: Transport and Environment, 81, 102278. https://doi.org/10.1016/j.trd.2020.102278
Hiscock, R., Pearce, J., Blakely, T., y Witten, K. (2008). Is Neighborhood Access to Health Care Provision Associated with Individual-Level Utilization and Satisfaction? Health Services Research, 43(6), 2183-2200. https://doi.org/10.1111/j.1475-6773.2008.00877.x
IDERA: Infraestructura de Datos Espaciales de la República Argentina (2020) Portal de Datos de IDERA. http://catalogo.idera.gob.ar/geonetwork/srv/spa/catalog.search#/home
INDEC: Instituto Nacional de Estadística y Censos (2000) Situación y Evolución Social, n. 4. Buenos Aires.
INDEC: Instituto Nacional de Estadística y Censos (2015) Censo Nacional de Población, Hogares y Viviendas. https://redatam.indec.gob.ar/argbin/RpWebEngine.exe/PortalAction?&MODE=MAIN&BASE=CPV2010B&MAIN=WebServerMain.inl&_ga=2.75108754.1833268215.1602010042-1881977071.1602010042
INDEC: Instituto Nacional de Estadística y Censos (2021) Condiciones de vida. Vol. 5, nº 6. Indicadores de condiciones de vida de los hogares en 31 aglomerados urbanos. Segundo semestre de 2020. Buenos Aires.
Kawabata, M. (2003). Job Access and Employment among Low-Skilled Autoless Workers in US Metropolitan Areas. Environment and Planning A: Economy and Space, 35(9), 1651-1668. https://doi.org/10.1068/a35209
Kawabata, M. (2009). Spatiotemporal Dimensions of Modal Accessibility Disparity in Boston and San Francisco. Environment and Planning A: Economy and Space, 41(1), 183-198. https://doi.org/10.1068/a4068
Kawabata, M., y Shen, Q. (2006). Job Accessibility as an Indicator of Auto-Oriented Urban Structure: A Comparison of Boston and Los Angeles with Tokyo. Environment and Planning B: Planning and Design, 33(1), 115-130. https://doi.org/10.1068/b31144
Kawabata, M., y Shen, Q. (2007). Commuting Inequality between Cars and Public Transit: The Case of the San Francisco Bay Area, 1990-2000. Urban Studies, 44(9), 1759-1780. https://doi.org/10.1080/00420980701426616
Kim, K., Ghorbanzadeh, M., Horner, M. W., & Ozguven, E. E. (2021). Identifying areas of potential critical healthcare shortages: A case study of spatial accessibility to ICU beds during the COVID-19 pandemic in Florida. Transport Policy, 110, 478–486. https://doi.org/10.1016/j.tranpol.2021.07.004
Li, S. (Alex), Duan, H. (Anna), Smith, T. E., & Hu, H. (2021). Time-varying accessibility to senior centers by public transit in Philadelphia. Transportation Research Part A: Policy and Practice, 151, 245–258. https://doi.org/10.1016/j.tra.2021.06.020
Neutens, T. (2015). Accessibility, equity and health care: Review and research directions for transport geographers. Journal of Transport Geography, 43, 14-27. https://doi.org/10.1016/j.jtrangeo.2014.12.006
Owen, A., y Levinson, D. (2014). Access Across America: Transit 2014 [Report]. Center for Transportation Studies, University of Minnesota. http://conservancy.umn.edu/handle/11299/168102
Owen, A., y Levinson, D. M. (2015). Modeling the commute mode share of transit using continuous accessibility to jobs. Transportation Research Part A: Policy and Practice, 74, 110-122. https://doi.org/10.1016/j.tra.2015.02.002
Penchansky, R., y Thomas, J. W. (1981). The Concept of Access: Definition and Relationship to Consumer Satisfaction. Medical Care, 19(2), 127-140.
Pereira, R. H. M., Saraiva, M., Herszenhut, D., Braga, C. K. V., y Conway, M. W. (2021a). r5r: Rapid Realistic Routing on Multimodal Transport Networks with R5 in R. Findings, 21262. https://doi.org/10.32866/001c.21262
Pereira, R. H. M., Vieira Braga, C. K., Mendes Servo, L., Serra, B., Amaral, P., Gouveia, N., Antonio Paez, A. (2021b) Geographic access to COVID-19 healthcare in Brazil using a balanced float catchment area approach. Social Science & Medicine, Volume 273. https://doi.org/10.1016/j.socscimed.2021.113773.
Polzin, S. E., Pendyala, R. M., y Navari, S. (2002). Development of Time-of-Day–Based Transit Accessibility Analysis Tool. Transportation Research Record, 1799(1), 35-41. https://doi.org/10.3141/1799-05
Shah, T. I., Bell, S., & Wilson, K. (2016). Spatial Accessibility to Health Care Services: Identifying under-Serviced Neighbourhoods in Canadian Urban Areas. PLOS ONE, 11(12), e0168208. https://doi.org/10.1371/journal.pone.0168208
Wan, N., Zhan, F. B., Zou, B. y Wilson, J. G. (2013). Spatial Access to Health Care Services and Disparities in Colorectal Cancer Stage at Diagnosis in Texas. The Professional Geographer, 65(3), 527-541. https://doi.org/10.1080/00330124.2012.700502
Wang, J., Du, F., Huang, J., & Liu, Y. (2020). Access to hospitals: Potential vs. observed. Cities, 100, 102671. https://doi.org/10.1016/j.cities.2020.102671
Wu, B. M., y Hine, J. P. (2003). A PTAL approach to measuring changes in bus service accessibility. Transport Policy, 10(4), 307-320. https://doi.org/10.1016/S0967-070X(03)00053-2
DECLARATION OF CONTRIBUTIONS TO THE ARTICLE - CRediT
|
ROLE |
LMartinazzo |
CFalavigna |
|
Conceptualization – Ideas; formulation or evolution of overarching research goals and aims. |
X |
X |
|
Data curation – Management activities to annotate (produce metadata), scrub data and maintain research data (including software code, where it is necessary for interpreting the data itself) for initial use and later re-use. |
X |
- |
|
Formal analysis – Application of statistical, mathematical, computational, or other formal techniques to analyze or synthesize study data. |
X |
- |
|
Funding acquisition - Acquisition of the financial support for the project leading to this publication. |
X |
- |
|
Investigation – Conducting a research and investigation process, specifically performing the experiments, or data/evidence collection. |
X |
- |
|
Methodology – Development or design of methodology; creation of models. |
X |
X |
|
Project administration – Management and coordination responsibility for the research activity planning and execution. |
- |
X |
|
Resources – Provision of study materials, reagents, materials, patients, laboratory samples, animals, instrumentation, computing resources, or other analysis tools. |
- |
X |
|
Software – Programming, software development; designing computer programs; implementation of the computer code and supporting algorithms; testing of existing code components. |
X |
- |
|
Supervision – Oversight and leadership responsibility for the research activity planning and execution, including mentorship external to the core team. |
- |
X |
|
Validation – Verification, whether as a part of the activity or separate, of the overall replication/reproducibility of results/experiments and other research outputs. |
X |
X |
|
Visualization – Preparation, creation and/or presentation of the published work, specifically visualization/data presentation. |
X |
- |
|
Writing – original draft – Preparation, creation and/or presentation of the published work, specifically writing the initial draft (including substantive translation). |
X |
X |
|
Writing – review & editing – Preparation, creation and/or presentation of the published work by those from the original research group, specifically critical review, commentary or revision – including pre- or post-publication stages. |
X |
X |