1. INTRODUCTION
In large organizations, a gap between strategic guidelines and what its project portfolio can provide in strategic terms is often observed. In this context, program management is presented as an efficient way to make the connection between strategies and development projects of the organization (Thiry, 2002; Pellegrinelli, 1997; Sanchezet al., 2009; Lycett et al., 2004).
According to recent PMI’s Standard for Program Management, a program is defined as a group of related projects managed together to deliver the organization goals and strategic benefits that result from the synergy between projects (Pellegrinelli, 1997; Lycett et al., 2004; Turner & Müller, 2003). In other words, a program is established to produce a strategic change in the organization (Smith et al., 2008; Pellegrinelli, 2011) or a lift to the desired level, providing new capabilities through the development of its component projects.
More recently, program management could be conceptualized as a set of processes, methods, and techniques that are all necessary to achieve integrated management of the projects contained in a program (Barletta, Caivano, Dimauro, Nannavecchia, & Scalera, 2020). The coordination of interactions between constituent projects of the program and between projects and the strategic level of the organization is what generates the main benefits obtained from implementing the strategy through the development of programs (Jiang, Klein, & Fernandez, 2018). This not only ensures that the products of projects are delivered as planned but also obtains benefits from the joint effect of projects for the development of the organizational strategy (Sanchez, Robert, Bourgault, & Pellerin, 2009). Poor management of programs, public or private, leads to several strategic failures (Lucena et al., 2016).
A program should not be immutable; its goals are associated with strategic benefits (Stretton, 2020) and should be unceasingly planned and negotiated with stakeholders (Project Management Institute, 2017) and should continuously be measured and reviewed during its development, since both the organization's strategy and objectives and the expected benefits from the program may change (Thiry, 2004) due to opportunities and difficulties encountered.
Although some standards already exist for managing programs such as The Standard for Program Management (Project Management Institute, 2017) and Managing Successful Programmes (Office of Government Commerce, 2007), there remain many uncertainties about how to develop programs, how to evaluate them to know their strategic nature, and how important functions attributed to their management such as risk management, must be undertaken.
Since program management has gained greater recognition as a link between strategic level and the organization’s projects (Thiry, 2002; Pellegrinelli S., 1997; Smith, Bower, & Aritua, 2008; Project Management Institute, 2017), program risk management has emerged as an important area for research and development. Due to its long duration and number of variables involved, important uncertainties and therefore risks are always present in the development of programs and can positively or negatively affect the achievement of objectives (Project Management Institute, 2017; Office of Government Commerce, 2007).
The program risk management is a function within the program management that is responsible for identifying, analyzing, and monitoring threats (or opportunities) in the program before they materialize (Milosevic, Martinelli, & Wadell, 2007) and distort the achievement of objectives and associated benefits. At first glance, the program risk management has a strong similarity with other risk management activities, particularly project risk management, but this similarity is only superficial (Lucena et al., 2016).
Despite that Program Risk Management embraces the traditional steps of planning, identification, analysis, response, and monitoring & control, a program differs greatly from a project - even from large or complex ones - since their goals and natures are very different (Mulambya & Zaaiman, 2021). While program management is concerned with strategic outcomes for the organization (Brito & Medeiros Jr., 2021), project management is concerned with a single result, within a setting, with cost and time constraints (Office of Government Commerce, 2007). Thus, managing program risks with a project-based view and with the same old procedures and techniques is a mistake (Lucena et al. 2016; Mulambya & Zaaiman, 2021); the natures of risks are different and require different management actions for programs as compared to projects.
This paper focuses on the Risk Analysis stage and intends to propose a new way of thinking about risk analysis giving a shift from the current paradigm that appreciates the simplicity of actions to one that values the effectiveness of the results.
2. LITERATURE REVIEW
2.1 Conceptualization of Program Risk
Risk is present everywhere in a way that for every circumstance (Jaber, 2019), we are faced with multifaceted uncertainty that somehow influences our decisions, actions, and even objectives sometimes. Risk can have many meanings depending on the field and application (Li et al., 2020), such as a possible danger, the probability of something to occur, the response variability, and so on.
In general, the risk is the identified and anticipated effect of an uncertain event on the results aimed at specific objectives and, therefore, can be positive or negative. In a simplified way, it has been defined by the ISO 31000:2009 standard: "risk is the effect of uncertainties on the objectives" (International Standards Organization, 2009); besides the incomplete, it fixes the main idea, per se.
Program risk is traditionally defined as an event or condition that, if it occurs, may affect the set of success criteria (concerning the objectives) of the program (Office of Government Commerce, 2007). This definition is very similar to that proposed for the project risk (Project Management Institute, 2017), but this similarity in concepts disguises deep differences in inputs, resources, and processes required to manage risks in projects and programs.
Managing risks in projects is conceptually simpler than in programs because the criteria for evaluating the success of projects are clearer and more easily measurable than those of the program. The project aims to deliver specific results, maintaining good performance in time, cost, and quality (Unegbu, 2020) according to what has been planned (Atkinson, 1999; Project Management Institute, 2017). Since the projects are used as instruments to achieve program objectives, the success indicators in the case of projects are ranked as tangible achievements, primarily. On the other hand, as the programs aim to achieve a series of strategic objectives and benefits for the organization, the intangible pointers predominantly comprise the leading success criteria for programs (Shao, Müller, & Turner, 2012).
Business environments are complex and possibly it may not be possible always to mitigate or control the risks. Although, risks can be continually influenced to be maintained on certain possible levels (Rasheed, et al., 2018). Since programs are linked to strategic issues, the program risks should be identified and assessed from a broader perspective. It is important to note that the objectives and benefits assigned to the program may deteriorate from the occurrence of events in each of the three management levels (Figure 1) - strategic, tactical (program), and operational (project).
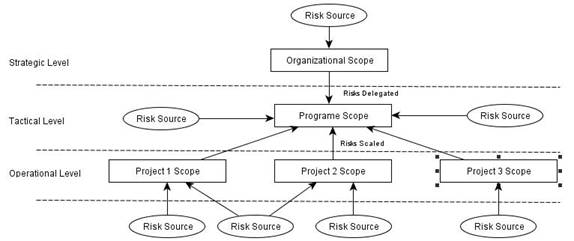
Figure 1: Program Risks Sources
Source: Based on Hillson, 2008.
Some risks perceived within the project management scope can significantly affect the parent program and be assigned to the program management. Additionally, the risks that arise at the strategic level can also be delegated to the program management (Hillson, 2008). Other risks may originate outside the organization and directly affect the program direction without having their effects readily perceived in the organizational or project scope.
From some references in the literature reviewed (Pellegrinelli S., 1997; Lycett, Rassau, & Danson, 2004; Project Management Institute, 2017; Hillson, 2008) and from the perception of these authors, a useful classification for program risks is outlined as follows:
a. Organizational Risks: Originated in the environment external to the organization, and capable of driving it to a change in its strategic direction and thus to change the set of goals or the importance of benefits planned for the program. Changes in the program's assumptions should be monitored and managed (Pellegrinelli S., 1997; Lycett, Rassau, & Danson, 2004) to minimize such risks.
b. Process Risks: They arise in the program itself and can affect, for example, its resource optimization goals and improvements in the interface of projects (Pellegrinelli S., 1997; Rai & Swaminathan, 2010) and others assigned to the program.
c. External Risks: They arise outside the organization but are not identifiable within the program context and may affect the objectives and benefits of programs even without affecting their development. They can be treated by the program management itself or can be scaled (i.e., high) at the strategic level if the treatment or consequences extrapolate the limits of action and the program team’s responsibility.
d. Escalated Risks: Identifiable only within a component project and capable of severely affecting it but may compromise (or leverage) the fulfillment of program objectives and benefits. Their treatment can also transcend the project scope and be scaled to higher levels (Hillson, 2008).
e. Aggregated Risks: arise within component projects of the program (Hillson, 2008) from a common source (or cause) that can generate consequences to two or more projects, thus affecting the program's objectives. Even in cases where these risks are treated within each project involved, the program must play its coordinating role (Pellegrinelli, 1997; Project Management Institute, 2017), so that the effectiveness of treatment actions can be improved.
The program risk categories proposed above were inspired primarily by the definitions presented by PMI (Project Management Institute, 2017) and Hillson (Hillson, 2008) but adapted to the concepts of program risk adopted in this study. Note that the proposed classification (figure 2) can include the risks arising from all risk sources shown in figure 1.
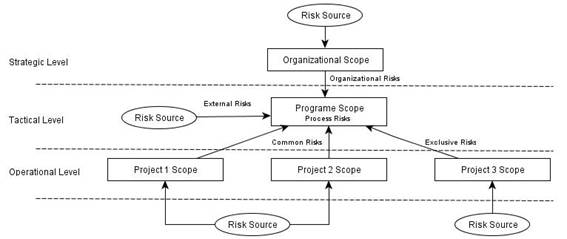
Figure 2: Types of Risk Management
Source: Authors (based on Hillson, 2008)
The purpose of this classification is to adequately indicate under which circumstances the program risks should be identified and contribute to seeking the best approach to analyze, treat, and monitor each of them.
If project risks threaten the program’s goals, they must be aggregated whenever possible and scaled to the scope of the program (Hillson, 2008) - according to the criteria adopted- to become program risks, which means that their analysis and treatment become the responsibility of the program.
It is important to clarify that the project risks should not be directly managed by the program unless they are relevant to the expected strategic outcomes and cannot be adequately treated within the project realm. The excessive direct intervention will affect the autonomy of project management (Project Management Institute, 2017) and divert the focus of program management on strategic issues. However, the risks of strategic significance should always be monitored by the program management even if their first level management occurs within component projects.
The decision about which risks should be escalated depends mainly on the clarity that every project manager has about the expected objectives and benefits set for the program because they are often more visible within the project.
2.2 The Traditional Approach for Program Risk Analysis
The risk analysis is necessary, primarily to the efficient allocation of scarce resources for the treatment of identified risks (Shankar et al., 2018), whether financial, personnel, or time. This stage should produce a prioritized list of risks according to their relevance to the program objectives. Some program risks, such as organizational, must always be considered as a priority; observed, and treated specially. Other program risks occur in a large number and often must undergo classification criteria to guide the team effort and concentrate them on the most important.
Risk analysis is the most complex stage of program risk management (Yoe, 2019), although it’s not the most laborious one. Care must be taken, and the effort employed should not exceed the value that this stage produces for the program. Risk analysis is an economic necessity that depends on the risk aversion of decision-makers; therefore, in general, the higher the availability of resources for the treatment of risks are, the lower is the need for precision in the analysis to establish treatment priorities.
The risk analysis may employ both quantitative and qualitative tools. Qualitative tools such as matrices and charts are though simple to understand and manipulate, they hardly produce accurate results. On the other hand, quantitative tools such as Monte Carlo simulation, influence diagrams, and fault tree analysis are more accurate and complex and require inordinate efforts, therefore, are reserved for complex, strategic, and sensitive issues (Hillson, 2008).
Traditionally, prioritizing risks happens first by the combination of the estimated probability of occurrence of the risk event (usually subjectively) and the impact of this event on one or more indicators of the program's success. The combination of these two judgments is translated into the relevance of risk that is used for prioritizing risks of the program (Project Management Institute, 2017; Hillson, 2008). So, the desire is to establish a coherent yet practical way to select and prioritize the most relevant risks to ensure the success of the program.
A commonly used methodology of qualitative risk analysis involves the use of scales of the probability of occurrence of the risk event, as well as the impacts caused by its occurrence in predefined dimensions. These two measures are arranged in a matrix of risk mapping (Kerzner, 2009) also known as probability and impact matrix.
By involving measures (even though in ordinal scale), the term “qualitative analysis” seems misused and should better be called “primary analysis”. The objectives of the program or rather, their goals are represented by indicators that may well reflect the consequences of the risks. The probability describes the uncertainty of the evaluators about the possibility of occurrence of the risk, while the impact is used to describe the effect of risks on program indicators, given the mapped causes.
The most widely used tool in the traditional approach to risk analysis is the risk matrix, the main argument for its widespread use is its simplicity of implementation. However, it’s recognized that there are several limitations in its use (Cox jr, 2008; Hubbard, 2009). For example, the matrix does not consider the difference in risk perception of individuals as a qualitative description of probability. It’s not difficult to conclude that some terms can be understood and evaluated differently by different evaluators even if they use standardized terms.
Other serious limitations are to allow the comparison of only a small number of discrete risks appropriately, not considering the dependencies between the risks, and the fact that the use of scales is not helpful for resource allocation. Cox Jr. examines these deficiencies interestingly and compellingly (Cox jr, 2008).
In the traditional approach of risk analysis, what you want is to assign each risk identified an index of risk, usually called the severity of the risk, so you can create a prioritization for the allocation of resources for risk treatment.
This risk index is usually calculated from its expected value, i.e., the product of the probability of occurrence (or not) of the risk event (without admitting that the risk can occur in varying degrees of impact) and assessing their impact (Jamshidnejad, 2021) on a particular indicator of the program, if it occurs. However, this risk index is the result of a “qualitative analysis” risk, which occurs through the choice of probability and impact scales, as shown in Table 1, below.
|
Category |
Probability |
Impact (US$ 1000) |
Points |
|
Very High |
Up to 91% |
Over 2.000 |
5 |
|
High |
61% - 90% |
1,000 - 1,999 |
4 |
|
Medium |
31% - 60% |
500 – 999 |
3 |
|
Low |
11% - 30% |
100 – 499 |
2 |
|
Very Low |
01% - 10% |
Until 99 |
1 |
|
Nothing |
0% |
No impact on budget |
0 |
Table 1: Example of Typical Scales of Probability and Impact
Source: Authors
Both probability and impacts on different dimensions to be evaluated must be represented by scales for easy understanding to support the evaluation. The practice shows the widespread use of 5 categories (ranges) to rate the probability and impact of a risk event on a dimension of assessment, and they are: very low, low, medium, high, and very high.
These scales are ordinal, and their values have no cardinal meaning, i.e., must not be used to perform mathematical operations (Kerzner, 2009). However, the “Risk Index - RI” (1), which is taken as the indicator that represents the risk importance (or ordinal position) concerning the set of identified risks is the result of the product of the probability score of the score attributed to the impact of the risk event:
RI = Probability * Impact (1)
The result of this product is positioned in a risk matrix, reflecting the risk tolerance of the sponsors of the program, as shown in Table 2, below.
|
Prob\Imp |
VL |
L |
Md |
H |
VH |
|
VH |
5 |
10 |
15 |
20 |
25 |
|
H |
4 |
8 |
12 |
16 |
20 |
|
Md |
3 |
6 |
9 |
12 |
15 |
|
L |
2 |
4 |
6 |
8 |
10 |
|
VL |
1 |
2 |
3 |
4 |
5 |
Table 2: Example of a Risk Matrix
Source: Authors
For example, an estimated risk event with a high probability of occurrence and medium impact on the desired indicator (budgeting, let's say) has an RI = 4 * 3 = 12 which corresponds to a risk of medium relevance, belonging to the yellow category of risk matrix adopted.
The limits of the colored regions should be established for each program evaluated and relate to the mapping definitions of the scales of probability and impact previously established. In this matrix, the risks evaluated and placed in the red region bear high relevance to the program, those in the yellow region have medium importance, and ones in the green region have low relevance to the program objectives.
It is suggested that the probability matrix is developed from the planning phase and should be continuously reviewed during the entire life cycle of the program. Furthermore, it should reflect the tolerance (or dislike) of the risk of program stakeholders. This irrefutable simplicity of use of risk matrix is however accompanied by several questions on its applicability; one is related to the use of these scales to represent qualitative probabilities and impacts on indicators that are quantitative (i.e., scale at least ordinal). Inconsistently, the same scales (supposedly ordinal) are used to compose the index of risk as to the product of values in these scales (violating the notion that the product operation is valid only for rational scales).
In specific cases, such as damage to the image of the organization, in which you want to avoid certain scenarios, a qualitative scale (actually ordinal) might serve as a reasonable alternative, instead. However, for many types of risks, measuring their impacts occurring only in monetary terms, much of the meaning is lost unnecessarily.
2.3 Biases of Risk Matrices
Though the simplicity of a technique is a strong attraction, it may not justify its limitations to be overlooked or compromised; because if the problem is complex and deserves a more accurate analysis, such simplicity is no longer a virtue. Some major limitations related to the use of risk matrices in program risk analysis are discussed below:
2.3.1. Loss of the Information in the Analysis
In applying the risk matrix, the expert is bound to decide on a predetermined category of the probability of occurrence of the risk event. There is no other option in this procedure; it’s easy to imagine that the probability can be 10 % or 50 % depending on the scenario he or she has in mind, for example.
The information available to the expert while choosing the probability of occurrence is the possible causes for the identified risk event and the current conditions, which suggests that what we have at the end is a conditional probability of the occurrence given the causes. However, it is not possible to identify the operations performed by experts to produce this preliminary information for one category of probability which will later be transformed into just a number (points).
For the selection of a category of impact, the expert must imagine that once the risk event occurs its impacts will have a unique magnitude. It is overlooked that the uncertainties may lead the expert to believe that risk may also cause, with different probabilities, a medium to high impact, for example. Decomposing this risk into two (one with “high impact” and another with “low impact”, for example) does not solve the problem, because these events would be mutually exclusive and cannot display dependencies clearly in the matrix.
In both cases, the expert judgment is reduced to a number mapping an index of risk, with significant loss of information (Bao et al., 2021; Adamy & Rani, 2022; Morais et al., 2022) and a false assessment of the uncertainty in the results.
Another loss of information occurs due to the heterogeneity of impacts where some impacts may be conceived in tangible formats while some others may not. Economic impacts, for example, are often expressed in monetary terms, but the same is not possible for some other kinds of impacts such as damage to the organization’s image. To ensure consistency between assessments of impacts measured on different scales it is necessary to use methods of evaluation of “subjective utility”, again compromising the apparent simplicity of the risk matrix.
2.3.2 Unclear Differentiation of Risks
Regardless of the amount of information that we have for each risk in the risk matrix, all risks considered are ranked using the identical procedure. The result of the process is a list of risks within each category of relevance (e.g., high, medium, or low).
However, an important observation of Kerzner is that this tool does not allow classifying risks within the same category of relevance (Kerzner, 2009). Thus, the program risk management must ensure to enlist consistency using other criteria such as urgency or complexity of the treatment. Therefore, the apparent simplicity does not preclude the initial complexity of prioritizing risks; if not all of them, at least to those belonging to the categories of highest relevance.
2.3.3 Inconsistency in the Analysis Results
Besides the many “draws” caused by the application of the risk matrix, there is no guarantee that a given event risk rated in a higher category is more important than a risk-rated in a lower category. A practical way to demonstrate this is through the following example:
Consider a particular risk event A, which is assumed to have a probability of approximately 65% and its impact is estimated at US$ 1.2 million. Using the categories set out in Table 1 we find that this risk has a high probability and high impact on the indicator, so the RI = 4 * 4 = 16, and the event risk is rated as “high” according to the risk matrix.
Now take another event risk B, whose experts imagine it has a probability of about 85%, and an estimated impact, if it occurs, is US$ 950,000. Using the same category set, its probability is classified as high and its impact as a medium with RI = 4 * 3 = 12 and the rating stands “medium” according to the risk matrix.
In the example above, you can see that if the expected cost is calculated directly from the expert evaluations the resulting costs for Risk A and Risk B turn out to be 780,000.00 and 807,500.00 respectively.
So, from the program budgeting point of view, Risk B should be considered more relevant and should receive more attention than Risk A. Such anomaly illustrates a serious error in the interpretation of the analysis through matrices. Besides, in both calculations, two important aspects were forgotten: the assessment uncertainty and the utility of the decision-maker signifying that the risk aversion may not be necessarily proportional to the monetary value.
2.3.4 Disregard to Risk Dependencies
When calculating the risk index for a list of identified risks, the risk matrix ignores the probabilistic dependence between the risks. Such dependencies can result from common causes of secondary risks (i.e., risk events which trigger other risk events if they occur), or even mutually exclusive risks (as noted above).
The risk matrix does not consider the side effects of the treatment applied, i.e., treating a risk by acting on the cause or preventing the risk event itself despite causes, or trying to reduce its impact by creating better conditions. Thus, when acting on a cause shared for various risks, benefits obtained on the set of risks are not considered by the matrix approach.
Consider, for example, a risk event A whose rank was considered high, so the traditional approach will have priority in the allocation of resources for its treatment, regardless of how it is decided to treat it and that have risks related to the same question whose treatment resulted in a more positive effect on the indicators of program reviews. Thus, some events classified as high risks may be considered for treatment and a lot of risks correlated by their causes classified as less relevant questions are not considered for treatment, causing a large potential loss.
This observation raises the following question: What do we want to identify? Risk events that influence (individually) the results assessed, or which display the actions that must be performed on the set of risks to obtain the best result in the indicator assessed? These questions put in judgment the “philosophy” of assessing the risk and treatment recommended in the traditional approach, more than simply choosing the appropriate tool to apply.
3. MATERIAL AND METHODS
For this study, a literature review on program risk management and program risk analysis was performed. The research was exploratory, not intending to systematically exhaust all the literature on the topics but focused on methods widely disseminated and used in the industry. The methods were formed so that their weaknesses were detected.
An unprecedented method was built based on the theory of decision analysis, in which all the previous problems raised were addressed. The new method was presented, through the study of a practical case, based on the current assumptions of risk assessment and proposing improvements for the analysis.
The strengths and weaknesses of the method were discussed and highlighted in this article. The next information will present the case study and its results.
4. RESULTS
The traditional approach to risk management provides well-defined steps, as noted in the previous topics. This topic will propose a mechanism through analysis of influence diagrams, which allows consideration of treatment outcome planned for the risks in the procedure of taking decisions and provides a tool for monitoring risks.
After briefly exploring some decision analysis concepts and influence diagrams this topic will show how this approach can replace the traditional one with additional benefits besides adding a little increase in effort and complexity.
4.1 Foundations of Decision Analysis to Program Risk Management
Managing risk in a program means making decisions and take actions to ensure that despite all the uncertain events, your goals are likely to be achieved to the best possible. Thus, a formal and consistent process for analyzing the insurgent decisions during the planning and development of the program is needed.
Howard tailored the term “Decision Analysis” to identify the formal and structured process of evaluating possible decisions when facing a particular problem (Howard, 1966). Decision analysis is a logical procedure used to perform the balancing of the factors that influence a decision, such as uncertainty, values , and decision-maker preferences (Howard, Research Report No. EES DA-79-2: Life and Death Decision Analysis, 1979).
In the presence of uncertainty, decision analysis does not intend to give the decision-maker the ability to get the best results for their decisions, but the best decision. It means that this procedure looks for logic and consistency in decision making, not the best result itself, since this is also a function of luck.
Though good decisions are expected to observe good results at large, the chances of surprise where good decisions may generate catastrophic outcomes sometimes or even bad decisions may result in good consequences occasionally may not be undermined.
Decision analysis just makes sense in an environment of uncertainty in which the preferences of a decision-maker exist, as is indeed the case of an organizational program.
An important development in the field of decision analysis was the rise of the influence diagram (Howard & Matheson, The Principles and Applications of Decision Analysis, 1984). This diagram offers a structure that can be easily understood by decision-makers and can also be used for solving computational problems in the environment.
Influence diagrams are graphical representations that support the understanding and troubleshooting of decisions under uncertainty. This graphical representation is a network of nodes connected by directed arcs.

Figure 3: Influence Diagram
Source: Authors
Nodes in an influence diagram can be classified as uncertainty nodes or chance nodes, represented by circles or ellipses, decision nodes, represented by rectangles, and value nodes, represented by hexagons.
The meaning of directed arcs (or arrows) depends on the types of nodes observed. An arrow between two nodes of uncertainty starting from A to B means that the probability of occurrence of B depends on the probability of occurrence of A.
The arrows arriving at a value node are called functional and represent the nodes whose node value depends. Finally, an arrow that part of a decision node to a node of uncertainty is called influence, which means that the probability assigned to a node depends on the decision. The absence of arrows between node A and node B means that A is not directly influenced by B and vice versa, i.e., the influence diagram shows the independence of the structure established and helps simplify the decision process.
4.2. Program Risk Analysis using Influence Diagrams
The influence diagram can be used for modeling the problem of program risk analysis divulging an aspect unexplored in the traditional approach: that is the influence of treatment adopted in the indicator observed. In this approach, it is not expected to obtain the relevance of each risk, but the treatments that result in greater efficiency of the overall indicator. Thus, the difficulty (cost) and benefits, i.e., efficiency and effectiveness of the possible treatments are also considered in the analysis.
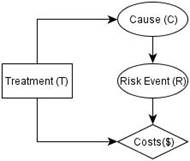 |
Figure 4: A Risk Problem in an Influence Diagram
Source: Authors
The diagram above (figure 4) shows that the decision of executing or not the treatment (T) of risk (R) will influence the probability of occurs the cause (C) that generates the risk event (R) and indirectly also influences the cost of the problem, in the scenario where corrections were necessary for the program.
If two or more treatments were available - influencing the probability of occurs C or acting directly in decreasing the probability of the risk event (R) occurs – we should observe the impact of each treatment on the overall cost (or other indicator used) and adopt a treatment that results in the lowest expected cost. Thus, the influence diagram is shown as the proper tool to support this analysis.
4.3. Alternative Approach to Risk Management and Risk Analyses: A Case Study
The alternative approach (to be presented in the next lines) considers that for more effective results, the risk analysis and planning response (to take the program to a level of acceptable risk), cannot be separated. The risk management process itself can be represented in an enhanced form, where it gives a highlight relevant at the delimitation of objectives, indicators, and targets of the program to be used as a basis for risk assessment and the connection between the analysis of the impact and the available treatments for the identified risks. We switch from the traditional structure to an alternative structure for risk management as shown in Figure 5, below.
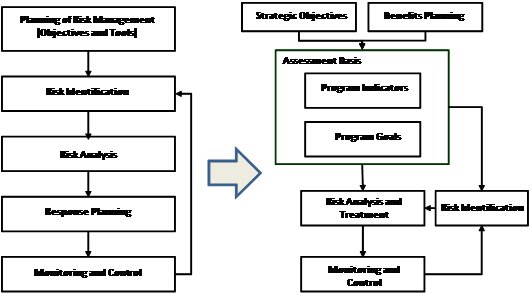
Figure 5: Risk Management – Traditional Approach vs Alternative Approach
Source: Authors (Adapted from PMI, 2013)
The representation of program risk to achieve in this alternative approach becomes different from that used for the traditional approach, which includes the treatment of risks and one or more global indicators.
To illustrate the operation of the alternative approach to risk analysis using influence diagrams, the following dummy program will be used:
A chain linked to an oil company works with the transportation and storage of petroleum through pipelines, pumping stations, and park tanking. Around one of its facilities, popular invasions were installed and due to good urban infrastructure, the region became intensely populated, increasing the risk of injury to persons, equipment, and pipelines.
Because it has no political power to remove the raised community, the company decided to develop a program for the repositioning of its pipelines and stations from that region to another more distant from populated areas to reduce the number of accidents involving people and facilities.
Some benefits were also targeted, such as obtaining a positive financial return with the implementation of the program, increasing the operational performance of the new transport system.
Some projects were approved to serve as a means of implementing the program:
· Install new pumping stations
· Install new oil transfer pipelines
· Relocate the small population of the new location for housing.
In an early stage of the program, a cycle of risk management was conducted. In this example, only the program budget has been used as an indicator for the risk analysis, although in the real case, other important goals may also be represented by additional indicators. Multiple indicators can be formally or mentally reduced to one impact indicator, finally.
The risk analysis performed produced the following risk list in table 3:
|
ID |
Risk Event |
Mapped Causes |
|
1 |
Interdiction of the new facilities |
- Communities living near the new facilities. - Problems with the environment. |
|
2 |
Pedestrian accidents in installation of new ducts. |
- Communities living near the new facilities. - Inappropriate infrastructure for vehicle traffic. |
|
3 |
Impossibilities of hire required equipment for the assembly of the oil pumping station. |
- High number of competing projects. |
|
4 |
Inability to meet the legal requirements for hiring local services. |
- Low qualification of local workers. - High number of competing projects. |
|
5 |
Damage to pipelines during installation. |
- Pipelines are difficult to handle. |
Table 3: Program Risk List
Source: Authors
In this paper, how to conduct risk identification has not been discussed. The information of the risk list above, including two proposes for treat risks (T1 and T2), has been used to generate the following influence diagram (figure 6):
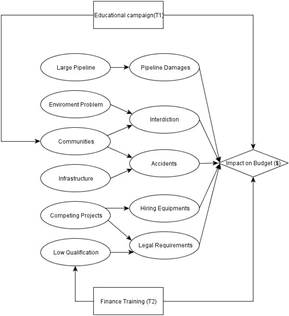
Figure 6: Integrated Analysis of Risk List
Source: Authors
With the probabilities previously extracted of each chance node, representing the causes and risk events, the value node is calculated from the impact of the occurrence of each risk on the program indicator, which in the subject case is represented as the program budget. Figure 7, below shows the influence diagram with bars that show the probabilities of the states in the nodes of chance and the expected utility of the node value, without treatment options:
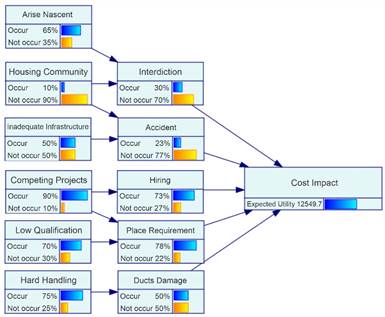 |
Figure 7: Example of Probability Elicitation using an Influence Diagram
Source: Authors
In this representation, all variables are probabilistic and there is no need for representation by categories or scales. In this example, it can be seen that according to the model presented the expected utility to the node value is an impact of US$ 12,549,000.00 on the program budget.
This alternative approach also allows new information to be easily inserted into the model. Returning to the example, suppose that a reliable source informed that major suppliers of equipment will start their activities in Brazil soon. That information directly affects the probability of occurrence of risk 3 (unable to hire the necessary for assembly of the pumping station equipment). Despite the high number of competitors, the entry of new suppliers drastically reduces the likelihood of failing to hire the necessary equipment to work.
![]()
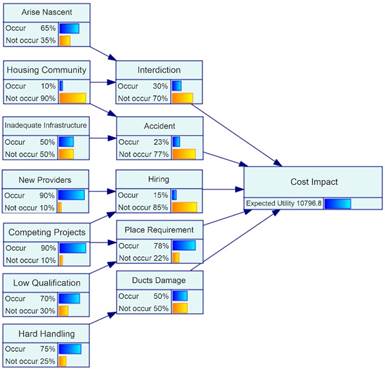
Figure 8: Negative Influence on a Risk Probability
Source: Authors
This concept introduces an innovation concerning the traditional approach through when are mapped only the causes that maximize the probability of the risk occurring. Figure 8 shows how the entry of this new variable, a negative influence, in the model changes the result:
With the inclusion of the node that represents the possibility of new equipment suppliers settle in Brazil, the likelihood of the risk of not being able to hire the necessary equipment reduces strongly. Consequently, the expected budget “overflow” falls from US$ 12,549,000.00 to US$ 10,796,000.00, which from the point of view of those interested in the program is a very positive change of scenery (figure 9).
Using appropriate software, several analyzes can be performed by activating only risk or sets of risks to observe its impact on the program pointer.
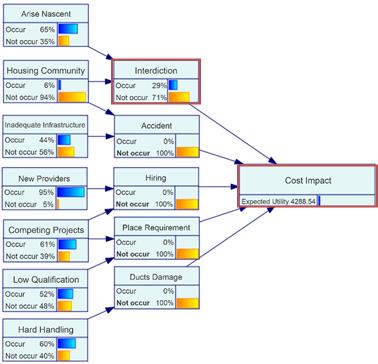
Figure 9: Sensitivity of Risk 1
Source: Author
The same exercise can be performed to assess the influence of each relevant risk in the program indicator which produces relevant information to the response planning of risks.
The analysis of the relevance of the list of risk events or mapped causes is not obtained directly, but an effort should be appropriate to the importance of the results. It should be noted that this list is not static and each new information inserted a posteriori (probabilities or treatments) performed in the model, priorities need to be reassessed.
Information about the causes and impacts of each risk on the global event indicator, allows the risk analyst and experts to create the treatment actions and include them in the model. Depending on the strategy adopted, on occasions, the treatment actions will be taken to neutralize the causes of risks and in other cases, these actions will serve to deactivate the effect of the risk event even if the cause remains active.
The ultimate goal of entering the treatment actions in the model is the possibility to elect for those that bring better results for a global indicator, which is not necessarily one that eliminates or mitigates the most significant risk since the cost or other treatment effects can affect the indicator reported such as the program budget.
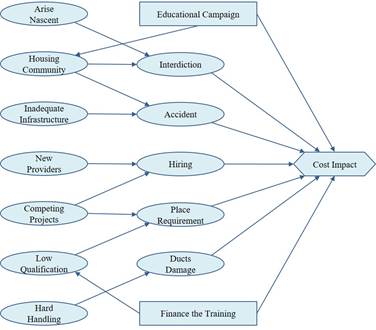
Figure 10: Influence Diagram with Treatment Actions
Source: Author
For the influence diagram shown in Figure 10 two actions were evaluated, the first suggests an educational campaign to warn residents of the dangers of life nearby to a great facility in construction, and the second one is the idea to finance the training of local labor to ensure the manpower required for the projects.
To evaluate the effectiveness of actions for this example we verify the expected value of the budget impact (table 4) and choose the best set of actions.
|
Action |
Run Action |
|||
|
1. Educative Campaign (T1) |
Yes |
Yes |
No |
No |
|
2. Finance the Training of Local Workers (T2) |
Yes |
No |
Yes |
No |
|
Expected Impact on Budget (US$ 1,000.00) |
1988,88 |
1905,95 |
2376,97 |
2302,67 |
Table 4: Impact of Actions on Budget
Source: Author
As noted in the example, although the treatment T2 act on a cause of risk “meet the legal requirements for local hiring”, its cost makes it impractical for execution at the program level.
This type of analysis is usually ignored when using the prioritization obtained from the risk matrix approach where each risk is treated as a priority order and not observed how actions can impact the program indicators. To obtain such an analysis, certainly, more information is required than the traditional approach. Besides the probability of each cause and event risk, it is also necessary to obtain (estimate) the impact of each risk event on the indicator analyzed, and if the impacts of components risks are not independent, an estimate of the joint impact also becomes essential. Moreover, we should estimate the effect of each action (risk treatment) on the variables of the model, i.e., how changes its probability of occurrence, and estimate the direct impact of the actions on indicators, when necessary.
This approach makes the analysis process more flexible because it allows us to evaluate many scenarios. We can make decisions about what actions to take to address the risk, which eliminates or reduce the impact on the indicator observed. In this approach, multiple indicators can be evaluated, rather than letting some decision-makers determine the trade-offs between indicators assessed.
This approach can still be considered positive or negative influences on the occurrence of risk events and precisely differentiates the causes of risk (likelihood of occurrence) from system conditions (certainty of occurrence). Thus, we consider that this alternative approach to risk analysis in programs is more complex than the traditional approach; however, it brings more consistent results through simple sequential analysis, since no information is lost during the evolution of the program.
5. CONCLUSION
There is a clear gap between what the program risk management currently described in the literature is and what it ought to be able to meet the strategic roles.
A program risk affects the program’s ability to meet its strategic objectives and its planned benefits. Thus, managing risks within the program is much more than just managing project risks that compose it.
Based on what has been exposed in this article, each program has its own set of success criteria, and that there is no “one size fits all” basket of indicators for program evaluation and therefore there are no universal criteria for managing program risks.
Ensuring, as much as possible, that projects occur as planned, does not guarantee the program success, which depends on many other factors associated with the strategic needs of the organization that change dynamically and uncertainly.
The program risks have been characterized according to their origin to clarify that risks from various organizational levels can influence the results of programs. Given these characteristics, it is possible to develop better ways for the identification, analysis, and treatment of each type of risk.
Besides, this study shows that an influence diagram can be used for program risk analysis with noticeable advantages over the traditional analysis this paper shows that, with some additional effort, the analysis can be gradually enhanced to clarify aspects and include new elements in the analysis to reach the joint consideration of risks and actions and to address them. This gradual evolution of the model of the problem offers several advantages. Among them is the provision of continuous updating and monitoring of the program, the recording of the history of risk as a valuable asset of organizational knowledge, and the integration of the cost-benefit analysis exposing the rationality of decision-makers.
In practical terms, we realize that investing in the use of a more accurate tool is viable despite its greater complexity since the object of the program management is important because it is the organizational strategy itself. Therefore, it is a tool that breaks the paradigm for analyzing operational risk analysis and gives a strategic character, which represents a significant contribution to the contents of this study.
Future studies should focus on the improvement of the feasibility in the implementation of these concepts, as they represent a cultural change and redefinition of responsibilities and profiles in the organization.
6. REFERENCES
Adamy, A., & Rani, H. A. (2022). An evaluation of community satisfaction with the government's COVID-19 pandemic response in Aceh, Indonesia. International Journal of Disaster Risk Reduction, 69, 102723. https://doi.org/10.1016/j.ijdrr.2021.102723
Atkinson, R. (1999). Project Management: Cost, time, and quality, two best guesses and a phenomenon, it's time to accept other success criteria. International Journal of Project Management, 17(6), 337-342. https://doi.org/10.1016/S0263-7863(98)00069-6
Bao, C., Wan, J., Dengsheng, W., & Jianping, L. (2021). Aggregating risk matrices under a normative framework. Journal of Risk Research, 24(8), 999–1015. https://doi.org/10.1080/13669877.2019.1588912
Barletta, V., Caivano, D., Dimauro, G., Nannavecchia, A., & Scalera, M. (2020). Managing a Smart City Integrated Model through Smart Program Management. Applied Sciences, 10(2), 714. https://doi.org/10.3390/app10020714
Brito, J. V., & Medeiros Jr., J. V. (2021). Alignment strategic in project-based businesses: a review of the literature. Iberoamerican Journal of Project Management, 20(1), 1-25. https://doi.org/10.5585/riae.v20i1.17902
Cox jr, L. A. (2008). What’s wrong with risk matrices? Risk Analysis. In Risk Analysis: An International Journal (Vol. 28, pp. 497-512). Hoboken, New Jersey: John Wiley and Sons INC. https://doi.org/10.1111/j.1539-6924.2008.01030.x
Hillson, D. (2008, October 19). Towards Programme Risk Management. Proceedings of PMI Global Congress North America, Denver, Colorado, USA, pp. 1-7.
Howard, R. (1966). Decision Analysis: Applied Decision Theory. Proceedings of the Fourth International Conference on Operational Research, (pp. 97-113). Boston. Fonte: https://sdg.com/wp-content/uploads/2015/06/Decision-Analysis-Applied-Decision-Theory.pdf
Howard, R. (1979). Research Report No. EES DA-79-2: Life and Death Decision Analysis. Stanford: Department of Engineering-Economic Systems, Stanford University.
Howard, R., & Matheson, J. (1984). The Principles and Applications of Decision Analysis. Melon Park: Strategic Decision Group.
Hubbard, D. W. (2009). The failure of risk management: why it’s broken and how to fix it (1ª ed.). Hoboken, New Jersey: John Wiley and Sons INC.
International Standards Organization. (2009). ISO 31000:2009. Risk Management - Principles and Guidelines. Geneva: International Standards Organization.
Jaber, A. Z. (2019). Assessment Risk in Construction Projects in Iraq using COPRAS-SWARA Combined Method. Journal of Southwest Jiaotong University, 54(4), 1-13. https://doi.org/10.35741/issn.0258-2724.54.4.28
Jamshidnejad, N. (2021). Project Portfolio Selection Based on Risk Index. Turkish Journal of Computer and Mathematics Education, 12(14), 1783-1788.
Jiang, J., Klein, G., & Fernandez, W. (2018). From Project Management to Program Management: An Invitation to Investigate Programs Where IT Plays a Significant Role. Journal of the Association for Information Systems, 19(1), 40-57. https://doi.org/10.17705/1jais.00480
Kerzner, H. (2009). Project management: A systems approach to planning, scheduling (10ª ed.). Hoboken, New Jersey: John Wiley and Sons INC.
Li, Y., Hills, T., & Hertwig, R. (2020). A brief history of risk. Cognition, 203, 1-11. https://doi.org/10.1016/j.cognition.2020.104342
Lucena, B. R., Lustosa, L. J., & Hillson, D. (2016). Program Risk Management: Making Strategy Possible. In C. Barclay, & K.-M. Osey-Bryson, Strategic Project Management: Contemporary Issues and Strategies for Developing Economies (pp. 154-175). Boca Raton, FL: CRC Press.
Lycett, M., Rassau, A., & Danson, J. (2004). Program management: a critical review. International Journal of Project Management, 22(4), 289-299.
Milosevic, D. C., Martinelli, R. J., & Wadell, J. M. (2007). Program Management for Improved Business Results. Hoboken, New Jersey: John Wiley and Sons INC.
Morais, C., Estrada-Lugo, H. D., Tolo, S., Jacques, T., Moura, R., Beer, M., & Patelli, E. (2022). Robust data-driven human reliability analysis using credal networks. Reliability Engineering & System Safety, 218, 107990. https://doi.org/10.1016/j.ress.2021.107990
Mulambya, E., & Zaaiman, H. (2021). A literature - and senior stakeholder- informed model of southern African programme risk management challenges. African Journal of Science, Technology, Innovation and Development, 13(6), 1-14.
Office of Government Commerce. (2007). Managing Successful Programmes (3ª ed.). Norwich: The Stationery Office.
Pellegrinelli, S. (1997). Programme management: organising project-based change. International Journal of Project Management, 15(3), 141-149. https://doi.org/10.1016/S0263-7863(96)00063-4
Pellegrinelli, S. (2011, February). What’s in a name: Project or programme? International Journal Project Management, 29(2), 232-240. https://doi.org/10.1016/j.ijproman.2010.02.009
Project Management Institute. (2017). A Guide to the Project Management Body of Knowledge (PMBOK® Guide) (6ª ed.). Pennsylvania: Newtown Square.
Project Management Institute. (2017). The Standard for Program Management (4ª ed.). Pennsylvania: Newtown Square.
Rai, V. K., & Swaminathan, N. (2010, April 5). Constructing Program Management Framework - A System of Systems Approach. IEEE International Systems Conference, San Diego, CA. https://doi.org/10.1109/SYSTEMS.2010.5482471
Rasheed, S., Yaqub, F., Wang, C. F., Memon, S., & Lucena, B. R. (2018). Risk Leveling – an organised risk management approach. International Journal of Risk Assessment and Management, 21(1/2), 135-153. https://doi.org/10.1504/IJRAM.2018.090266
Sanchez, H., Robert, B., Bourgault, M., & Pellerin, R. (2009). Risk Management applied to projects, programs, and portfolios. International Journal of Managing Projects in Business, 2(1), 14-35. https://doi.org/10.1108/17538370910930491
Shankar, R., Choudharya, D., & Jharkharia, S. (2018). An integrated risk assessment model: A case of sustainable freight. Transportation Research Part D, 63, 662-676. https://doi.org/10.1016/j.trd.2018.07.003
Shao, J., Müller, R., & Turner, J. R. (2012). Measuring Program Success. Project Management Journal, 43(1), 37-49. https://doi.org/10.1002/pmj.20286
Smith, N. J., Bower, D., & Aritua, B. (2008, November 9). A Complexity Science Based Approach to Programme Risk Management. 22nd IPMA World Congress.
Stretton, A. (2020). Strategic initiatives, project/program management, and responsibilities for benefits realization. PM World Journal, 10(5), 1-21.
Thiry, M. (2002). Combining Value and Project Management into an Effective Program Management Model. International Journal of Project Management, 20(3), 221-227. https://doi.org/10.1016/S0263-7863(01)00072-2
Thiry, M. (2004). "For DAD": A Programme Management Life-Cycle Process. International Journal of Project Management, 22(3), 245-252. https://doi.org/10.1016/S0263-7863(03)00064-4
Turner, J., & Müller, R. (2003). On the nature of the project as a temporary organization. International Journal of Project Management, 21(1), 1-8.
Unegbu, H. C.-a. (2020). An investigation of the relationship between project performance measures and project management practices of construction projects for the construction industry in Nigeria. Journal of King Saud University - Engineering Sciences, In Press. https://doi.org/10.1016/j.jksues.2020.10.001
Yoe, C. (2019). Principles of risk analysis: decision making under uncertainty (2nd ed.). CRC Press.
DECLARATION OF CONTRIBUTIONS TO THE ARTICLE - CRediT
|
ROLE |
BLucena |
S Rasheed |
GMiranda |
|
Conceptualization – Ideas; formulation or evolution of overarching research goals and aims. |
X |
|
|
|
Data curation – Management activities to annotate (produce metadata), scrub data and maintain research data (including software code, where it is necessary for interpreting the data itself) for initial use and later re-use. |
X |
|
|
|
Formal analysis – Application of statistical, mathematical, computational, or other formal techniques to analyze or synthesize study data. |
X |
X |
X |
|
Funding acquisition - Acquisition of the financial support for the project leading to this publication. |
X |
|
|
|
Investigation – Conducting a research and investigation process, specifically performing the experiments, or data/evidence collection. |
X |
|
|
|
Methodology – Development or design of methodology; creation of models. |
X |
X |
|
|
Project administration – Management and coordination responsibility for the research activity planning and execution. |
X |
|
|
|
Resources – Provision of study materials, reagents, materials, patients, laboratory samples, animals, instrumentation, computing resources, or other analysis tools. |
X |
|
|
|
Software – Programming, software development; designing computer programs; implementation of the computer code and supporting algorithms; testing of existing code components. |
X |
|
|
|
Supervision – Oversight and leadership responsibility for the research activity planning and execution, including mentorship external to the core team. |
X |
|
|
|
Validation – Verification, whether as a part of the activity or separate, of the overall replication/reproducibility of results/experiments and other research outputs. |
X |
X |
X |
|
Visualization – Preparation, creation and/or presentation of the published work, specifically visualization/data presentation. |
X |
X |
X |
|
Writing – original draft – Preparation, creation and/or presentation of the published work, specifically writing the initial draft (including substantive translation). |
X |
X |
|
|
Writing – review & editing – Preparation, creation and/or presentation of the published work by those from the original research group, specifically critical review, commentary or revision – including pre- or post-publication stages. |
X |
X |
X |