|
RPD |
Revista Produção e Desenvolvimento Research in Production and Development |
eISSN: 2446-9580 Doi: https://doi.org/10.32358/rpd.2020.v6.484 |
USE OF FLEURIET MODEL FOR FORECASTING AND EVALUATING MUNICIPAL ELECTORAL RESULTS IN A BRAZILIAN STATE
Edson Vinicius Pontes Bastos (http://orcid.org/0000-0002-6948-6390)1*
1 Universidade Federal do Rio de Janeiro, Rio de Janeiro - RJ, 21941-617, Brazil
* engenheiroedsonbastos@gmail.com
Submitted: 22/10/2020. Accepted: 30/12/2020
Published: 31/12/2020
ABSTRACT
Objective: Verify the relation between the variables in the Fleuriet model and the electoral result given by the exchange or maintenance of the party of the prefectures under analysis.
Methodology: Through logistic regression it is possible to explain or predict the probability of the occurrence of the event under analysis, such event discussed here refers to the exchange of the party, which is a dummy variable that assumes a value of 1 when there is an exchange and zero otherwise, the method of estimation used to obtain the coefficients was based on maximum likelihood.
Results: The relationship between the variables of the Fleuriet model and the electoral result given by the exchange or maintenance of the party in the prefectures of the group under analysis.
Limitation or implication of the research: It is noteworthy that such research does not allow generalizations, being a study with reduced scope considering only the city halls of the State of Rio de Janeiro that have financial information disclosed.
Originality: showing that city halls with better financial situation tend not to change the party, which was observed in the group under analysis considering the election event in 2020.
Keywords: forecasting models, financial health, accounting, political stability, regional development.
USO DO MODELO FLEURIET PARA PREVISÃO E AVALIAÇÃO DOS RESULTADOS ELEITORAIS MUNICIPAIS EM UM ESTADO BRASILEIRO
RESUMO
Objetivo: verificar a relação entre as variáveis do modelo Fleuriet e o resultado eleitoral dado pela troca ou manutenção de partido das prefeituras do grupo em análise.
Metodologia: Por meio de regressão logística é possível explicar ou prever a probabilidade de ocorrência do evento em análise, tal evento aqui discutido refere-se à troca da parte, que é uma variável dummy que assume o valor 1 quando há um troca e zero caso contrário, o método de estimação utilizado para obter os coeficientes foi baseado na máxima verossimilhança.
Resultados: a relação entre as variáveis do modelo Fleuriet e o resultado eleitoral dado pela troca ou manutenção do partido nas prefeituras do grupo em análise.
Limitação ou implicação da pesquisa: Ressalta-se que tal pesquisa não permite generalizações, sendo um estudo de abrangência reduzida considerando apenas as prefeituras do Estado do Rio de Janeiro que possuem informações financeiras divulgadas.
Originalidade: evidenciando que prefeituras com melhor situação financeira tendem a não mudar de partido, o que foi observado no grupo em análise considerando o evento eleitoral em 2020.
Palavras-chave: modelos de previsão, saúde financeira, contabilidade, estabilidade política, desenvolvimento regional.
1. Introduction
Accounting and tax information are important tools available to society (Paiva and Carvalho, 2018; Dobroszek et al., 2019). Cities accounts must be periodically presented to citizens and government control, in compliance with the principle of transparency provided for administrative law. Silva et al. (2015) show that the financial statements in the same economic sector present similarities due to their patrimonial and economic structures, thus, they should present similar performance in relation to the sector average. Indexes that are quite different from the sector averages show that some management anomaly may be ongoing and needs to be reviewed.
Crisóstomo and Melo Junior (2015) mention that the pressure for more transparency and quality of management has led to the emergence of legal instruments and guidelines regarding the adoption of Corporate Governance practices. Braga et al. (2004) state that there is a vast analytical tool available to those who wish to assess the economic and financial aspects reflected in the financial statements ranging from traditional financial ratios to conceptually well-founded systems such as the Fleuriet Model. The Academy is incorporating in its research data from public management in order to produce models applicable to decision makers.
Fleuret’s model provides an analytical view and effectively reveals the need for working capital and the best way to apply it, (Silveira et al., 2015) by segregating current (short-term) assets into cyclicals and erratic. In this context, according to Braga et al. (2004), Fleuret’s model defines the quality of the financial situation of entities based on the configuration of certain equity elements, without the need to perform interpretations to arrive at a diagnosis, unlike traditional analyzes that require an effort of interpretation and presents traditional results.
The relevance of economic and financial management using the Fleuriet model has been found in articles of Almeida et al. (2013), Ambrozini et al. (2014), Silva et al. (2016), Cavalcanti and Longhin (2016), and Chiachio and Martinez (2019), studied models that aid decision making and planning. In this context, the objective is to verify the relation between the variables in the Fleuriet model and the electoral result given by the exchange or maintenance of the party of the prefectures of the group under analysis, this study is justified and aims to evaluate, from the perspective of the liquidity and applicability analysis of the Fleuriet model, the regional development. The article intends to know the performance of Rio de Janeiro cities that make finance data available on Finbra (2019) with information declared by the cities themselves. Official data referring to expenses, revenues, assets, and liabilities of municipal public entities. This paper aims to highlight the results of the liquidity and risk analysis of the financial structure of brazilian cities based on the Fleuriet Model.
Regional governments are obliged to develop and utilize advances in information technology to improve their abilities to manage regional finance and to channel regional financial information to public services (Setiyawati and Doktoralina, 2019). Risks with working capital management requires the adoption of models that help in constant monitoring of results (Cavalcanti and Longhin, 2016). The relevance of this paper is the importance of making improvements in the analysis of public accounts. A more structured analysis allows the promotion of a better allocation of public resources, in compliance with the State's duties towards the taxpayer.
In addition to this introduction, this paper presents a literature review on the subject. Next, the results and conclusions are developed.
2. Bibliographical Review
Understanding the cities dynamics is very important because of economics activities and their development indices (Biscalchim & Barreira, 2020). Indicators are essential management tool for monitoring and evaluating activities, as they allow them to monitor the achievement of goals, identify progress, quality improvements, correct problems, and change needs (Carvalho et al., 2016). For Mathiasi et al. (2016), insolvency forecasting models offer analysts and managers an advanced tool, free of subjective influences, enabling them to classify the entity's “financial health”.
In an attempt to make accounting functional, that is, allocated the entity's reality, providing a systemic approach to the economic and financial situation, according to Silva (2016), Fleuret’s dynamic model reclassifies the Balance Sheet into erratic accounts (assets and financial current liabilities), cyclical (assets and operating current liabilities), and not cyclical (assets and non-current liabilities). The Current Assets, Noncurrent Assets, Current Liabilities, Noncurrent Liabilities and Shareholders' Equity accounts, which make up the Balance Sheet, are reclassified and divided into erratic accounts and cyclical or non-cyclical accounts (Silva et al., 2016).
In this way the decisions of managers can be interpreted. As it is possible to identify their consequences and guide as to the future directions that should be adopted. In an attempt to make the model functional, it is necessary to modify the Balance Sheet, separating the accounts of liabilities and assets into three groups: Current Erratic (or financial), Current (or operational) and Non-Current, as can be seen in the Table 1 below:
Table 1: Balance Sheet Reclassification
|
ASSETS |
PASSIVE |
||
|
CURRENT ASSETS |
CURRENT LIABILITIES |
||
|
Errátics |
Boxed Cash |
Discounted Duplicates |
Errátics |
|
Banks |
Short Term Loans |
||
|
Financial Application |
Dividends payable |
||
|
|
|||
|
Cíclics |
Duplicates Received |
Providers |
Cíclics |
|
Stocks |
Salaries payable |
||
|
Advances to suppliers |
Social charges |
||
|
Prepaid expenses |
Taxes and fees |
||
|
|
|||
|
Non cíclics |
NON-CURRENT ASSETS |
NON-CURRENT LIABILITIES |
Non cíclics |
|
|
Long Term Liabilities |
||
|
Long term achievable |
|||
|
Investments |
NET WORTH |
||
|
Immobilized |
Share capital |
||
|
Intangible |
Reservations |
||
|
|
Accumulated losses |
Source: Adapted from Fleuriet et al. (2003)
Based on these Balance Sheet data, the variables that make up Fleuret’s dynamic analysis listed in Table 2 below are calculated. The Balance Sheet accounts are reclassified to noncurrent or Working Capital (CDG), operating or Working Capital need (NCDG) and financial or Treasury Balance (ST). Fleuriet, et al. (2003) state that this reclassification considers the dynamic reality even before it is linked to different types of decision making by managers.
Table 2: Fleuriet Model Variables
|
CALCULATION |
|
|
NCDG |
CURRENT ASSETS - CURRENT LIABILITIES |
|
CDG |
NON-CURRENT LIABILITIES - NON-CURRENT ASSETS |
|
ST |
CDG – NCDG |
Source: Adapted from Fleuriet et al. (2003)
Working Capital Needs (NCDG) refers to the difference between the cyclical asset and the cyclical liability, in which it will seek the permanent application of funds and accounts linked to the operations. Cyclic asset and liability accounts are termed short-term, renewable and are linked to operating activities. According to Matarazzo (2010) the need for working capital is the key to the financial management of an entity. Azevedo (2016) argues that the need for working capital shows the time and value mismatch between the operations that cyclical asset and liability accounts represent. Thus, it shows the mismatch between the asset and liability accounts, linked to activities, thus being related to the financial cycle.
Working Capital (CDG) depicts the difference between noncurrent liabilities and noncurrent assets, which are non-cyclical accounts. If decisors knows how to manage the CDG, it will have good results even with low liquidity or negative result. Treasury Balance (ST) is defined as the difference between the erratic asset and the erratic liability. Erratic asset and liability accounts are short-term and may or may not be renewable and linked to operating activities. This variable will inform if the CDG finances NCDG when ST is negative. This means that the CDG is insufficient to finance NCDG, while positive shows short-term resources for immediate application, but the entity may not be taking advantage of existing market opportunities.
Once calculated, an analysis of the entity's financial position structure with respect to liquidity and solvency over a given period of time can be followed based on the values found. This analysis is structured according to table 3 below:
Table 3: Types of Financial Situation
|
TYPE OF STRUCTURE AND FINANCIAL SITUATION |
||||
|
TYPE |
CDG |
NCDG |
ST |
SITUATION |
|
1 |
+ |
- |
+ |
GREAT |
|
2 |
+ |
+ |
+ |
SOLID |
|
3 |
+ |
+ |
- |
UNSATISFACTORY |
|
4 |
- |
+ |
- |
VERY BAD SITUATION |
|
5 |
- |
- |
- |
TOO BAD |
|
6 |
- |
- |
+ |
HIGH RISK |
|
NOTE: (+) INDICATES POSITIVE VALUE AND (-) INDICATES NEGATIVE VALUE |
||||
Source: Adapted from Fleuriet et al. (2003)
This classification can be explained as follows (Vieira, 2008; Cavalcanti and Longhin, 2016; Silva et al., 2016):
Type 1 - evidences an excellent financial situation, since it denotes Working Capital, that is, available resources, a negative need in which the sources of capital overlap the cash outflows, therefore, the positive cash balance shows funds available for investments.
Type 2 demonstrates a sound financial situation, where cash outflows occur before inflows, but working capital becomes sufficient to meet the financial needs and generate cash balance.
Type 3 reveals an unsatisfactory situation with no financial resources for investments, as its assets are being financed by short-term resources (loans, financing), and working capital meets the momentary need.
Type 4 shows a risk of insolvency as it finances permanent assets with short-term debt and is not expected to expand due to negative cash balance.
Type 5 has extremely poor financial structure, with negative CDG, NCDG and ST. Thus, we can infer the need for long term resources to improve the CDG, therefore the ST.
Type 6 reveals a high-risk structure where negative NCDG is more than sufficient to fund negative CDG, and there are still resources to invest in the short term, which justifies the positive cash balance. The risk is that there will be an economic downturn that will cause sales to fall and NCDG to be positive, with risk if it cannot get financing for permanent assets.
Silva et al. (2016) points out that the results obtained with the application of the model show how much the Working Capital Needs variable is related to the entity's financial situation, in an inverse correlation, and that an increase in NCDG may influence negativities.
3. Methodology
Regarding the methodological procedure the study is classified as a descriptive documentary approach, since it aims to analyze the financial performance of cities with data obtained from the FINBRA portal that make up the research sample in light of the Fleuriet Model, a proposed analysis tool also used by Bastos and Mello (2019). The use of accounting tools, according to Pistore et al. (2015), demonstrates and provides conditions for analysis and improvement that should be used to improve performance.
With the data available on the FINBRA portal from 2017 to 2019 of the State of Rio de Janeiro, in terms of ST CDG and NCDG. In the first part of the analysis, we sought to interpret the new reclassification obtained by the dynamic model through the three Fleuriet variables: Working Capital (CDG), Working Capital needs (NCDG) and Treasury Balance (ST), and after the Statistical analysis was performed using the logit regression technique as suggested by Bastos et al. (2019) and supported by the R® statistical program. By logit regression it will be possible to identify the degree of relation between the variables of the Fleuriet model, NCDG CDG, ST, by the R2 Cragg-Uhler (Nagelkerke) value. Depending on this value, it will be possible to perceive the existence of other influences on the ST variable besides those that are here under study NCDG and CDG and change in the political party. Generally, in regression models, you want to get the highest R² value. In the first step the Change in the political party, a binary indicator will be considered as a dependent variable, to be predicted based on CDG, ST and NCDG, obtained by the new reclassification of the balance sheet as proposed by Fleuriet, encompassing all cities of the State of Rio de Janeiro.
Dummypartido = (NCDG) + (CDG) + (ST) + (DummyTipo.1)
The dummy representing the party's changes being the dependent variable assumes 1 if there was change and zero otherwise, and the Scissor Balance (ST), Working Capital (CDG) and Working Capital Needs are the independent variables together with the dummy of the situation type 1. Subsequently, the analysis will proceed in an interpretative manner, which will seek a real diagnosis of the working capital of the cities (CDG), the situation of the need for working capital (NCDG) and the scissors effect. With this, a standard model can be elaborated with the results achieved, thus aiming to compare the cities of the state to further evaluate the result obtained, with a view to proposing a new technique to be used in the process of analyzing the balance sheets of the cities' accounts from Rio de Janeiro state.
4. Characterization of the accounting environment under study
The State of Rio de Janeiro currently has 92 cities, Figure 1, and has an estimated total population in 2020 of 17.366.189 people.
Figure 1: Map of Rio de Janeiro State
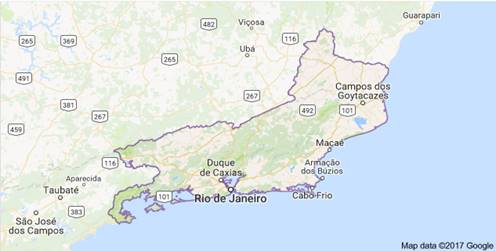
Source: Google Maps (2019).
This study used data from 74 cities of the State of Rio de Janeiro that had their complete balance sheets disclosed on the portal Siconfi - National Treasury Secretariat, with the purpose of applying a model of financial analysis in the public accounts of these municipal entities, using to such, Fleuriet's dynamic analysis and the statistical method of multiple regression.
4.1. Fleuriet model applied to municipal balance sheets
Starting from the new reclassification of municipal balance sheets from the perspective of the dynamic model, we obtained the variables that will indicate the financial situation. After collection, it follows with the operationalization of the model applied to the balance sheets for subsequent critical analysis of the results obtained enabling a mapping of the current situation of the cities.
It is generally known that assets and liabilities are classified according to their chronological order of maturity, for example, assets are classified based on the time required for complete conversion into cash or consummation. Thus, current assets and current liabilities are obtained. Similarly, the classification of liabilities follows, in the chronological order expected to be paid.
The dynamic model proposes exactly a modification in the classification above, it is noticed that some accounts have very slow movement, with that, they become the permanent or non-cyclical group. In others there is a continuous and cyclical movement and there are still some with discontinuous movement that are called erratic because they are not intrinsically related to the operational cycle under study. For the application of this model in the balance sheets, it will be framed in the following format:
- Permanent accounts.
- cyclical accounts.
- Erratic accounts.
Current assets have been reclassified to cyclical assets and erratic assets, given their nature, resources directly related to the operation, such as inventories, are included in the cyclical assets account, since, considering the existence of the institution, this asset will always exist cyclically, rotating. Therefore, it is possible to measure their turnover and are inserted in the operating cycle of the entity. Items that do not have this operational relation are considered erratic items, are short-term accounts, not necessarily renewable, their continuity of existence has no defined nature.
Similarly, current liabilities are subdivided into cyclical liabilities and erratic liabilities, cyclical liabilities are fundamental and necessary for the operation, they are part of the cycle of operations, such as payables, labor obligations, wages. Erratic liabilities, on the other hand, are liabilities linked to the financial cycle, not necessarily renewable.
To obtain cyclical assets, one of the items in the cyclical accounts, the following items in the balance sheet were considered:
1.1.2.0.0.00.00 - Short term credits
1.1.5.0.0.00.00 - Stocks; and
1.1.9.0.0.00.00 - Decreasing Equity Variations Paid in Advance
To calculate the cyclical liabilities, the following items were considered:
2.1.1.0.0.00.00 - Short-term Labor, Social Security and Assistance Obligations
2.1.3.0.0.00.00 - Suppliers and Short-term Accounts Payable
2.1.4.0.0.00.00 - Short-Term Tax Liabilities
2.1.7.0.0.00.00 - Short-term provisions; and
2.1.8.0.0.00.00 - Other Short-Term Obligations
From the difference between cyclical assets and cyclical liabilities, the working capital need (NCDG) was calculated. Working capital, on the other hand, was obtained by adding noncurrent liabilities to shareholders' equity less noncurrent assets. The treasury balance was obtained through the difference between the financial asset and the financial liability.
Working Capital needs, Working Capital and Treasury Balance concepts that can be viewed as an economic-accounting concept and not as an imposed legal or normative definition. The traditional formal classification often does not make it possible to clearly identify the accounts on public balance sheets.
An important aspect observed in the need for working capital (NCDG) is its high degree of activities dependence, so there is a certain degree of sensitivity to changes in the economic scenario such as the current scenario of falling tax revenues, such as IPTU and ISS. In some cases, there is a need for negative working capital, which indicates that cash outflows occurred before inflows.
4.2. Application of the logit regression statistical method
The logistic regression econometric model was used and, following the guidelines of Gujarati (2006), Corrar, Paulo and Dias Filho (2007) and Fávero et al. (2009), to estimate the regression functions, the method of estimation used to obtain the coefficients was based on maximum likelihood method and for the operationalization of the regressions the software R was used where the probability of error type I, for analysis of the assumptions was defined in 5 %, this way, we have a 95% confidence index (CI). The analysis of the coefficient R² will be validated by means of the p-value of the test, while for the validation of the coefficients of the regressors, the p-value of the individual test will be used, being analyzed on the aspects of 1% 5% and 10% significance as supervised by Bastos, Bortolon and Maia (2020). The dummy representing the party's changes being the dependent variable, and the Scissor Balance (ST), Working Capital (CDG) and Working Capital Needs are the independent variables together with the dummy of the situation type 1.
The variables of the Fleuriet model were standardized, following the criterion of subtraction of the mean value divided by the standard deviation. This is a resource widely used in econometric modeling, more specifically, this concept consists of subtracting the value of a variable, here represented by the signs of the Fleuriet model, its mean and dividing the result by the standard deviation of the sample. Therefore, if X represents a variable with a sample mean x ̅ and standard deviation σ, and if this data set is replaced by the variable Z = (X - x ̅) / σ, the desired standardized variable Z is obtained. Given this transformation, this new sample will have an average of zero and a standard deviation of 1.
Therefore, standardization means moving the center of a data set to the origin of the coordinate system. In this way, the variability, represented by the standard deviation, becomes unitary. Consequently, any and all sets that are subjected to standardization will have a standard deviation equal to one, regardless of the original standard deviation of the sample. This methodology allows and simplifies the comparison of standardized sets. It is worth mentioning that standardization is not normalization, if the original distribution is normal, standardization will not change the distribution, so it will remain normal. Likewise, if the probability distribution adhering to the sample is not normal, standardization will not make the distribution normal. From the table 4, we note that the model was statistically significative.
Table 4 – Results from Econometric models
|
Dependent variable: |
|
|
dummypartido |
|
|
NCDG) |
-0.073 |
|
(0.318) |
|
|
CDG) |
-0.961** |
|
(0.488) |
|
|
ST) |
0.838* |
|
(0.490) |
|
|
Tipo.1 |
-1.627** |
|
(0.796) |
|
|
Constant |
2.585*** |
|
(0.561) |
|
|
Observations |
74 |
|
Log Likelihood |
-25.797 |
|
Akaike Inf. Crit. |
61.594 |
|
Note: |
*p**p***p<0.01 |
Source: elaborated by the author.
The test was performed to verify the desired absence of multicollinearity between the independent variables, as a result of which all VIF values below 5 were obtained for the independent variables. Values greater than 10.0 may indicate a collinearity problem, with the minimum possible value being 1.0. It is known that the problem of multicollinearity is only a matter of degree, since there will always be a correlation between the predictors, the desire is that this correlation is low between the predictors.
Model 1 can be considered significant as a whole, considering a level of significance of 5%, which is the probability of type I error, it is worth mentioning that when the probability of occurrence of type I error increases, the probability of type II error decreases. Through logistic regression it is possible to explain or predict the probability of the occurrence of the event under analysis, such event discussed here refers to the exchange of the party, which is a dummy variable that assumes a value of 1 when there is an exchange and zero otherwise, the method of estimation used to obtain the coefficients was based on maximum likelihood. The model does not require assumption of normality of residues or heteroscedasticity test, however, the autocorrelation between residues and the correlation between residues and independent variables were tested.
It is observed that the variable of the Fleuriet CDG model, representative of working capital is statistically significant and negative, that is, it has an inverse relationship with the variable party change, with this there is evidence that the greater the working capital of the entity the less likely it is that the party will change in the elections. The Type 1 financial situation type variable also has statistical significance at the 5% significance level, with which it is noted that the presence of the type 1 financial situation attribute contributes by reducing the probability of party switching. Finally, the last significant variable is the ST balance, which is statistically valid at the significance level of 10%, has a positive value indicating that its contribution to the party's probability of exchange is, therefore, positive.
This fulfills the objective of verifying how the variables of the Fleuriet model are related to the permanence or not of the government of the entity under analysis. Due to the confusion matrix, the above model has an accuracy of 87%.
The logistic regression presents a value of R2 Cragg-Uhler (Nagelkerke) equal to 0.16, According to Nagelkerke, N. (1991) this value represents a kind of pseudo-R2 for Logistic Regression and serves to compare competing models. It is a transformation of Cox-Snell R2 so that the values are between 0 and 1. Its type is, the bigger the better. These results align to suggestion of Setiyawati and Doktoralina (2019) can promote regional development if regional governments improve and use advances in information technology to improve their abilities to manage regional finance and to channel regional financial information to public services.
Fleuriet (2015) confirms that this classification into financial structure types by means of the variables NCDG, CDG and ST is adequate to determine the institution's liquidity situation and to predict the risk of the financial structure under analysis. This scale qualifies the financial situation of municipalities, and It is well known that the logit regression model is conveniently used when one wishes to explain the behavior of a given dependent variable through predictor variables as ratified by Hair Jr. et al., (2005).
The initial objective to verify the relation between the variables in the Fleuriet model and the electoral result given by the exchange or maintenance of the party of the prefectures of the group under analysis and applying a financial analysis model to the public accounts of the cities of Rio de Janeiro state was fulfilled, trussing Fleuret’s dynamic analysis and the logit regression statistical method, through the specific objectives that were also met. when reclassifying the balance sheet of municipal accounts in accordance with the dynamic model.
Table 5 – Fleuriet Classification
|
Cities |
Change in the political party |
Change in political ideology |
||
|
1 (Araruama, Belford Roxo, Bom Jardim, Cantagalo, Cardoso Moreira, Casimiro de Abreu, Comendador Levy Gasparian, Cordeiro, Duque de Caxias, Iguaba Grande, Japeri, Porciúncula, Rio Claro, Rio das Ostras, São Fidélis, São João da Barra, São Pedro da Aldeia, São Sebastião do Alto, Silva Jardim, Trajano de Moraes, Valença) |
21 |
34% |
16 |
10 |
|
2 (Areal, Arraial do Cabo, Barra do Piraí, Barra Mansa, Cambuci, Conceição de Macabu, Engenheiro Paulo de Frontin, Itaboraí, Itaguaí, Italva, Itatiaia, Macaé, Macuco, Maricá, Mendes, Mesquita, Natividade, Niterói, Paraty, Piraí, Quatis, Queimados, Resende, Santa Maria Madalena, Santo Antônio de Pádua, São Gonçalo, São José de Ubá, Saquarema, Tanguá, Varre-Sai, Vassouras) |
31 |
50% |
27 |
13 |
|
3 (Angra dos Reis, Nilópolis, Nova Friburgo, Nova Iguaçu, Paty do Alferes, Pinheiral, Teresópolis) |
7 |
11% |
6 |
4 |
|
4 |
0 |
0% |
0 |
0 |
|
5 (Miracema, Rio das Flores) |
2 |
3% |
2 |
2 |
|
6 (Carapebus) |
1 |
2% |
1 |
1 |
Source: Elaborated by the author
In general, from the table above, it is noted that the that most city halls are allocated to type 2 of financial situation considered solid, followed by type 1 with representativeness equal to 34. In order to analyze how the relation between the party exchange takes place and the types of financial situation, a logistic regression with the variables of the Fleuriet model will be estimated as follows: Dummypartido = (NCDG) + (CDG) +(ST) + (DummyTipo.1). Following the guidance of Biscalchim & Barreira (2020) about evaluate cities problems, this study will contribute to a better understanding of dynamics in cities and territories. The perception that the economy and population satisfaction can influence the city's political management and can contribute to the construction of what Mathiasi et al. (2016) call it "insolvency forecasting models", because they are models that can correlate "financial health" with quality of life and political stability.
CONCLUSIONS
The research fulfilled its proposed objectives. The main findings of this research are related to the potential application of the Fleuriet model in public finances, as noted. This dynamic model is widely used in the business environment. There is an absence of this tool in the governmental scope, thus, this study contributed to its exploratory role, initiating a use that is still a theme that does not exist in the municipal public management literature. It is noteworthy that the convergence of public accounting with international standards allows its application in public balance sheets.
In addition to the reclassification obtained in this research and discussed above, the logit regression statistical method was applied and validated in the new accounting reclassification obtained by the Fleuriet model. Through the regression equation obtained, its output can be used as a comparative value, analogous to a standard index, to the results observed experimentally. This technique can be proposed to be used in the process of analyzing the balance sheets of municipal accounts of the State of Rio de Janeiro. The statistical method of logit regression proved to be relevant, primarily due to the simple fact that all assumptions for model validation were tested and validated at significance level equal to 0,05. From this, it can be affirmed that there is in fact an explanatory relationship between the dependent and the independent variable. These parameters serve to support a comparative analysis within the management of municipal balance sheets. Based on this model used as a basis, one can obtain estimated NCDG CDG and ST values and compare them with actual values observed in practice. In addition, one can proceed by looking at the impacts of working capital and needs of working capital in ST and again compare with their respective impacts already predicted by the regression angle coefficients. Thus, it is considered that the work fulfilled its objective of proposing a tool to aid a comparative analysis of municipal balance sheets.
It is observed that the result found indicates that most cities are classified in the type of financial situation considered optimal or solid, when reading this result in parallel with the actual economic situation observed today, the question arises regarding the quality information disclosed in the municipal balance sheets. In addition, a major problem observed throughout the survey was the high number of cities that did not disclose their balance sheets or partially disclose it. These municipal entities were excluded from the reclassification process for lack of information, which may be considered more serious than the worst type of financial situation predicted by the model, type 06, as what is not disclosed does not comply with the principles of transparency and needs to be further investigated by external control bodies.
Type 01 cities have a positive working capital, indicating that financing sources with a maturity of more than 1 year are greater than non-current assets. In addition, a positive CDG indicates that current assets are higher than current liabilities, which generates a current liquidity ratio of over one. Another relevant fact present in the cities of this group is that they all have negative NCDG, which cannot be considered a problem at first, given the possibility of these cities to maintain a financial structure with a small long-term liability and net worth. Negative NCDG entities tend to react faster in crisis and recession scenarios.
The third group, of unsatisfactory nomenclature stands out for presenting the greatest need working capital of this group, with a value much higher than the others. The cities of the unsatisfactory group have as their main feature the fact that their cash balance is negative. Thus, part of its working capital needs (NCDG) is financed by short-term loans, but these loans are not repaid within their operating cycle which characterizes an undesirable event to some extent even though their CDG is positive. The group 04 of bad financial situation did not obtain any identified City. Already the analysis for the type 05 financial situation “Very bad” were classified in. Municipalities in type 05 have all negative variables, a negative ST indicates a financing of working capital needs and noncurrent assets. Its negative working capital indicates permanent net financing, i.e., there is a partial financing of non-current assets due to short-term loans. Because your working capital is less than zero, current liquidity ratio is less than one. The high-risk level 06 cities have a permanent net financing given their negative working capital, indicating that their noncurrent assets are partially financed by Short term loans. In addition, its working capital needs (NCDG) is also negative which indicates a positive cash reserve despite the negative state of its working capital.
REFERENCES
Almeida, M. A. P; Valverde, A. R.; Horta, E. D. (2013). A análise dinâmica segundo o Modelo de Michel Fleuriet: o caso da empresa Cemig Distribuições S.A. Anais... XXIV ENANGRAD, Florianópolis, SC.
Ambrozini, M.A.; Matias, A. B.; Pimenta Junior, T. (2014). Análise Dinâmica de Capital de Giro Segundo o Modelo Fleuriet: uma Classificação das Empresas Brasileiras de Capital Aberto no Período de 1996 a 2013. Contabilidade Vista & Revista, 25(2), 15-37.
Azevedo, M. J. M. (2016). Modelo de Fleuriet: Aplicação do Modelo de Análise Dinâmica de Capital de Giro para Avaliação de Desempenho da Petrobras de 2008 a 2015. Universidade de Brasília (UnB) Faculdade de Economia, Administração e Contabilidade (FACE).
Bastos, E., Bortolon, P., & Maia, V. (2020). Fundamentalist Signals in Volatility Scenarios: Evidence in the Brazilian Stock Market. Brazilian Business Review, 17(6), 621-639. https://doi.org/10.15728/bbr.2020.17.6.2
Bastos, E. V. P.; Mello, J. A. V. B. (2019). Proposta de índice padrão para predição de eficiência e análise de contas públicas municipais. Revista de Globalización, Competitividad y Gobernabilidad. 13(2), 50-71. https://doi.org/10.3232/GCG.2019.V13.N2.02
Braga, R.; Nossa, V.; Marques, J. A. V. C. (2004). Uma proposta para a análise integrada da liquidez e rentabilidade das empresas. Revista Contabilidade & Finanças, São Paulo, 15(Edição Especial), 51-64. https://doi.org/10.1590/s1519-70772004000400004
Carvalho, M. S., Castro, P. C., Guabiroba, R. C. (2016). Eficiência e eficácia de clubes de futebol – uma análise comparativa. Revista Produção e Desenvolvimento, 2(2), 101-114. https://doi.org/10.32358/rpd.2016.v2.124
Cavalcanti, J. M. M.; Longhin, T.M. (2016). Modelo dinâmico e modelo tradicional para avaliação do capital de giro: um estudo de caso das empresas do setor de siderurgia listadas na Bm&fBovespa durante o período de 2010 a 2014. Revista de Administração de Roraima - RARR, 6(1), 71. https://doi.org/10.18227/2237-8057rarr.v6i1.3185
Biscalchim, B. R., & Barreira, A. (2020). CITIES THAT ARE LOSING INHABITANTS: AN ANALYSIS OF THE BRAZILIAN REALITY. Revista Produção E Desenvolvimento, 6. https://doi.org/10.32358/rpd.2020.v6.432
Chiachio, V. F. D. O., & Martinez, A. L. (2019). Effects of the Fleuriet model and liquidity ratios on tax aggressiveness. Revista de Administração Contemporânea, 23(2), 160-181.
Crisóstomo, V. L.; Melo Junior, C. V. (2015). Uma análise comparativa de indicadores financeiros entre empresas listadas em segmentos diferenciados Bovespa e as do mercado tradicional. Revista Perspectivas Contemporâneas, 10(3), 15-34.
Cox, D. R., & Snell, E. J. (1989). The analysis of binary data (2nd ed.). London: Chapman and Hall
Dobroszek, J., Zarzycka, E., Almasan, A., & Circa, C. (2019). Managers’ perception of the management accounting information system in transition countries. Economic Research-Ekonomska Istraživanja, 32(1), 2798-2817. https://doi.org/10.1080/1331677x.2019.1655466
Fávero, L. P., et al. (2009). Análise de dados. Modelagem multivariada para tomada de decisões. Rio de Janeiro: Campus.
Finbra. (2016). Finanças do Brasil. <https://siconfi.tesouro.gov.br/ > disponível em 18 ago. 2016.
Fleuriet, M.; Kehdy, R.; Blanc, G. (2003). O Modelo Fleuriet – a dinâmica financeira das empresas. 5. ed. Rio de Janeiro: Elsevier.
Fleuriet, M.; Zeidan, R. (2015). O modelo dinâmico de gestão financeira 1. ed. Rio de Janeiro: Alta books.
Gujarati, D. Econometria Básica. Rio de Janeiro: Campus/Elsevier, 2006.
Hair Jr, Joseph F.; Anderson, Rolph E.; Tatham, Ronald L.; Black, William C. (2005). Análise multivariada de dados. Tradução Adonai Schlup Sant’Anna e Anselmo Chaves Neto. 5. ed. Porto Alegre: Bookman.
Matarazzo, D. C. (2010). Análise Financeira de Balanços: Abordagem básica e gerencial. 7. ed. São Paulo: Atlas S/A.
Mathiasi, H.; Rui, A.; et al. (2016). Seleção de atributos contábeis na previsão de insolvência de empresas brasileiras–uma comparação de abordagens. Revista Base (Administração e Contabilidade) da UNISINOS, 12(1). https://doi.org/10.4013/base.2015.121.03
Mauss, C. V.; Souza, M. A. (2008). Gestão de Custos Aplicada ao Setor Público: modelo para mensuração e análise de eficiência e eficácia governamental. São Paulo: Atlas.
Montgomery, W. (2012). Probabilidade e estatística na Engenharia. 4 ed. São Paulo: LTC, 2012.
Nagelkerke, N. (1991). A note on a general definition of the coefficient of determination.
Paiva, I., & Carvalho, L. (2018). Accounting and management practices in the third sector in Angola. Accounting and management practices in the third sector in Angola, (3), 28-42. https://doi.org/10.14254/2071-789x.2018/11-3/2
Pistore, G. C., Foscarini, R., Philereno, D. C., Silva, I. A. D., & Faccin, K. (2015). Contabilidade de Custos para formação de preço de venda: um estudo de caso em uma indústria de suspensões pneumáticas de Caxias do Sul-RS. Revista Produção e Desenvolvimento, 1(1), 31-49. https://doi.org/10.32358/rpd.2015.v1.55
Setiyawati, H., & Doktoralina, C. (2019). The importance of quality accounting information management in regional governments in Indonesia. Management Science Letters, 9(12), 2083-2092. https://doi.org/10.5267/j.msl.2019.6.025
Silva, G. R. et al. (2016). Um estudo sobre o modelo Fleuriet aplicado na gestão financeira de empresas do setor elétrico listadas na Bm&fBovespa. Revista Ambiente Contábil Universidade Federal do Rio Grande do Norte, 8(81), 12. https://doi.org/10.21680/2176-9036.2018v10n2id13848
Silva, G. R.; Lopes, J. E. G.; Pederneiras, M. M. M.; Tavares, M. F. N.; Silva, E. E. D. (2016). Um estudo sobre o modelo Fleuriet aplicado na gestão financeira de empresas do setor elétrico listadas na BM&FBOVESPA. Revista Ambiente Contábil, 8(2), 92-109. https://doi.org/10.11606/d.96.2014.tde-18082014-102308
Silveira, E.; Zanolla, E.; Machado, L. (2015). Uma classificação alternativa à atividade econômica das empresas brasileiras baseada na tipologia Fleuriet. Revista Portuguesa e Brasileira de Gestão, 14(1), 14-25.
Vieira, M. V. (2008). Administração estratégica de capital de giro. 2. ed. São Paulo: Atlas.